Next: WEIGHTED LEAST-SQUARES
Up: GENERAL FORMULATION OF THE
Previous: GENERAL FORMULATION OF THE
To illustrate the method and compare the results from the different
schemes described here, we have generated a simple synthetic dataset using
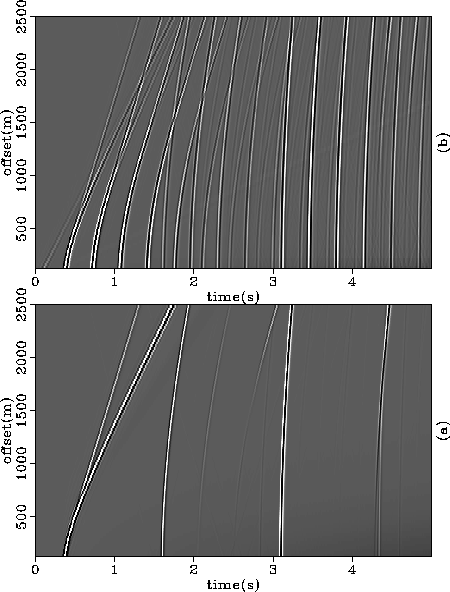
an elastic modeling program. Figure ![[*]](http://sepwww.stanford.edu/latex2html/cross_ref_motif.gif) -a shows the
reverberation-free data obtained with the elimination of the
surface (air-water) boundary. The pure P wave reflections are the
events at approximately 0.4, 1.6, and 3.1 seconds. Some converted PSPP and
PSSP reflections are also visible at the far offsets between 2.0 and 3.0
seconds, and at about 4.5 seconds. The more realistic dataset
(with the surface boundary present), which has been
used as input for the several multiples suppression schemes, is shown in
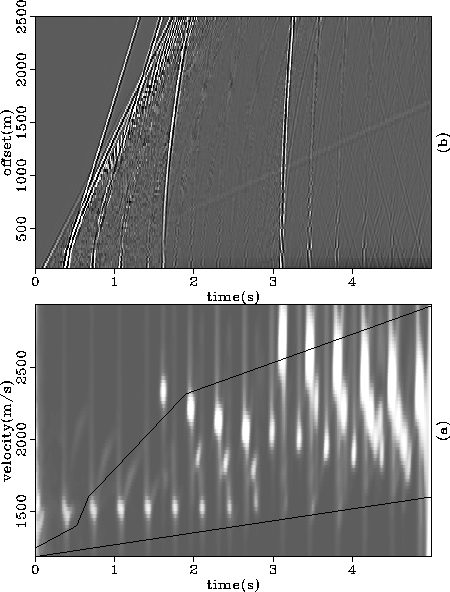
Figure -b. Figure -a shows the semblance
spectrum of the data overlaid with the manually designed window in
which reverberations are dominant. The result of applying the basic
scheme described by equation (4) to the data in
-b is shown in Figure -b.
syntdata
-a shows the
reverberation-free data obtained with the elimination of the
surface (air-water) boundary. The pure P wave reflections are the
events at approximately 0.4, 1.6, and 3.1 seconds. Some converted PSPP and
PSSP reflections are also visible at the far offsets between 2.0 and 3.0
seconds, and at about 4.5 seconds. The more realistic dataset
(with the surface boundary present), which has been
used as input for the several multiples suppression schemes, is shown in
Figure -b. Figure -a shows the semblance
spectrum of the data overlaid with the manually designed window in
which reverberations are dominant. The result of applying the basic
scheme described by equation (4) to the data in
-b is shown in Figure -b.
syntdata
Figure 1 (a) Synthetic data, free of surface-related reverberation. (b)
Synthetic data with surface-related reverberations.


 semrm0
Figure 2 (a) Semblance panel of the data of Figure -b,
overlaid with the manually designed window function.
(b) Result of applying the scheme defined by
equation (4) to the same data.
Next: WEIGHTED LEAST-SQUARES
Up: GENERAL FORMULATION OF THE
Previous: GENERAL FORMULATION OF THE
Stanford Exploration Project
12/18/1997