Next: RESERVOIR FLUID FLOW
Up: IMAGES OF FLUID FLOW
Previous: Spatial images of fluid
I have described some very complex and intriguing features
visible in the time-lapse seismic images. These features are
almost certainly associated with fluid-flow processes in the
P and K reservoirs since they correlate with steam injection depths,
and very few seismic changes are seen in the overburden images.
Similar features are visible in the other time-lapse data sets,
and evolve spatially with time.
Such dramatic changes in seismic data during
steam injection raise many interesting questions, including the following:
- Do the bright reflections and time delay in the reservoir
indicate the presence of steam, or merely hot regions?
- Should we be able to distinguish separate fluid-fronts
of water, oil and steam?
- Can we resolve the vertical and lateral distribution
of steam in the upper and lower formations?
- What could be causing time pull-up (velocity increase)
to the north and west of the injector?
- What is the explanation for the large polarity reversal
to the south and east along the base of reservoir reflection?
- Why are changes within the reservoir confined to a radius
of only 50 m, whereas changes below the reservoir extend
at least 350 m out to the edge of the survey area?
In the following sections, I attempt to answer some of these questions
by carefully considering a simple model of steamflood fluid flow,
rock physics core measurements and analysis, finite-difference seismic
modeling, and seismic image and velocity analysis.
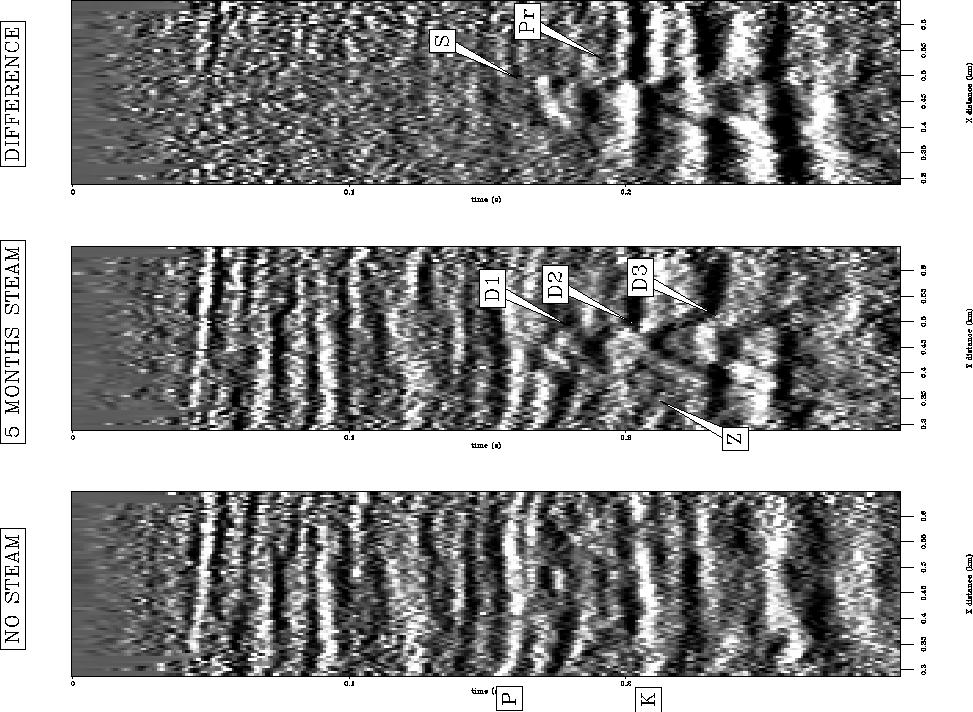
inline-stks-ann
Figure 6 3-D stacked inline sections:
before steam injection (left), after 5 months of steam (center),
and the difference (right).
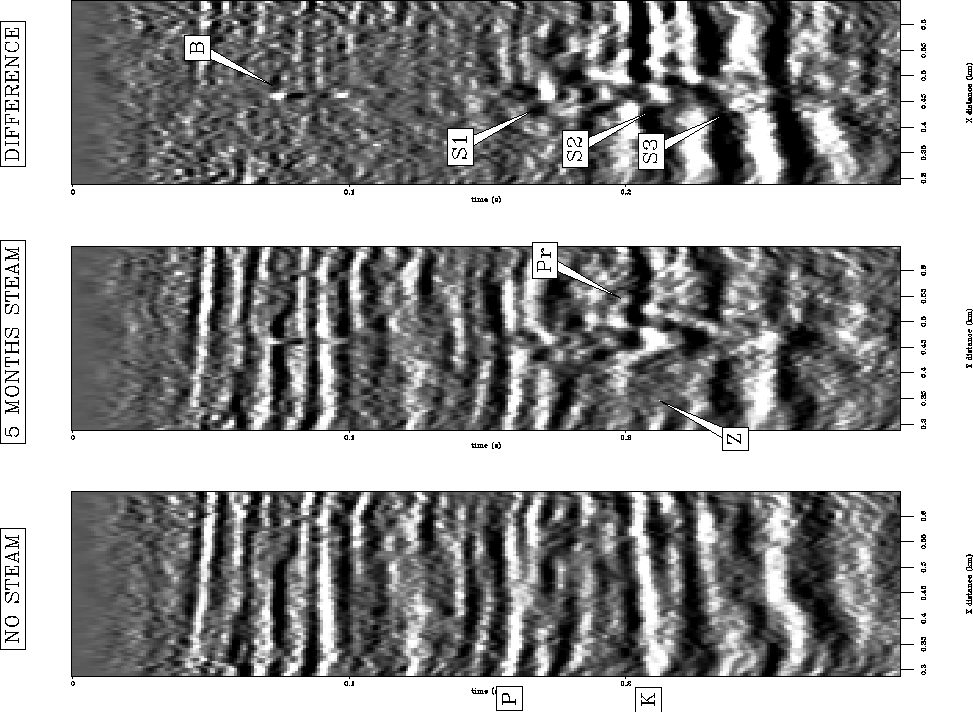
 inline-migs-ann
Figure 7 3-D migrated inline sections: before steam injection (left),
after 5 months of steam (center), and the difference (right).
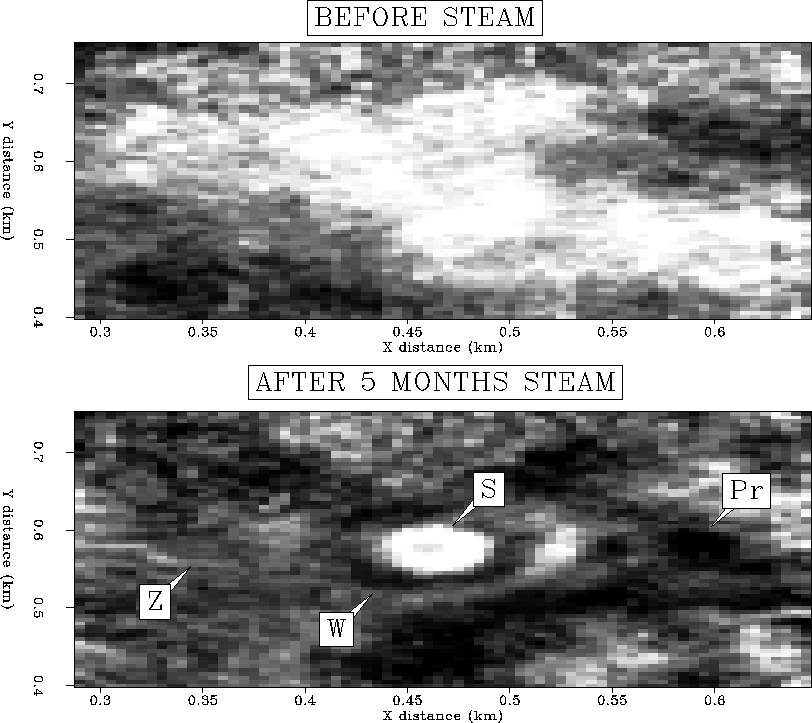
tslice-migs-ann
Figure 8 3-D migrated time slices at the base of the P reservoir (208 ms): before steam injection (top), and after 5 months of steam
injection (bottom).
Next: RESERVOIR FLUID FLOW
Up: IMAGES OF FLUID FLOW
Previous: Spatial images of fluid
Stanford Exploration Project
11/12/1997