


The first step is to sort and bin the trace headers
on a regular grid, by using the Sort90 program.
We define a three-dimensional grid, with the grid axes being the
absolute value of the offset, the in-line midpoint coordinate,
and the cross-line midpoint coordinate.
Since for 3-D data the source-receiver offset is a vector,
we could define azimuth of this vector as an additional grid axis;
we leave this possibility as an exercise to the reader.
The midpoint distribution is irregular (Figure ![[*]](http://sepwww.stanford.edu/latex2html/cross_ref_motif.gif) ),
therefore it is likely that more than one trace belong to the same grid cell.
If this overlap happens, Sort90 automatically adds
an axis (called trace_number_in_bin) to the grid,
making the grid a four-dimensional object.
Notice that the sorting and binning are performed
on the trace headers and do not require
access to the seismic traces.
However, as an option,
Sort90 can reorder the data themselves after having
sorted and binned the headers.
),
therefore it is likely that more than one trace belong to the same grid cell.
If this overlap happens, Sort90 automatically adds
an axis (called trace_number_in_bin) to the grid,
making the grid a four-dimensional object.
Notice that the sorting and binning are performed
on the trace headers and do not require
access to the seismic traces.
However, as an option,
Sort90 can reorder the data themselves after having
sorted and binned the headers.
Once the grid has been computed we can
extract many interesting subsets of the data
by using the windowing program Window90.
This program can extract specified slices from
the four-dimensional grid created by Sort90.
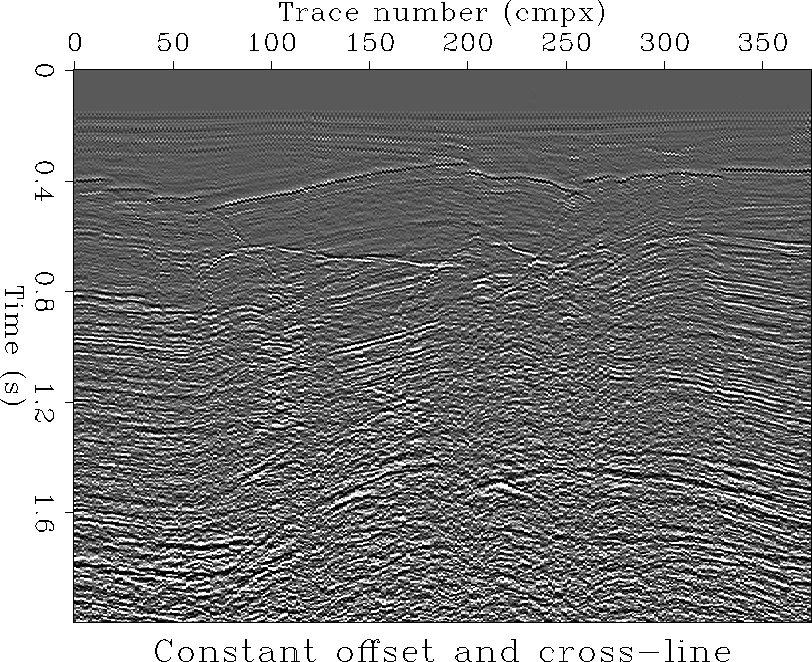
For example we can display the subset
of traces that correspond to grid cells
with the same offset and cross-line midpoint.
Figure shows one of this ``common-offset'' sections.
We can see the complex structures below the surface,
with plenty of faultings and diffractions.
Similarly we can extract a CMP gather at any desired locations,
as the one shown in Figure .
Because the sorting and the binning have been done
once by Sort90, and the pointers to the
data traces corresponding to the grid cells are
stored in the Grid Value File, Window90 can extract
these subsets very quickly without the need to
go through the whole data set, but just by extracting
the desired traces from the Data Value File.
 |


|
Cdp
Figure 8 CDP gather | 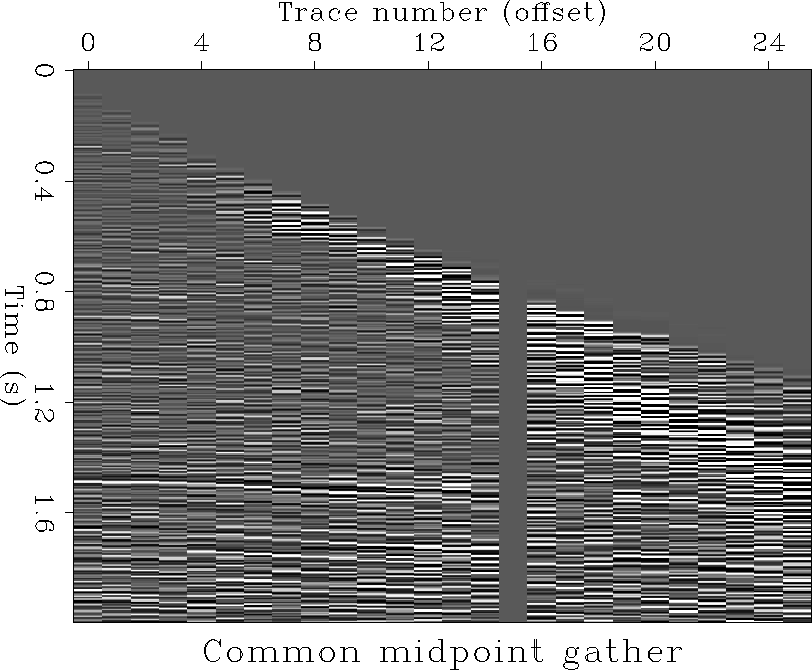 |