


The first thing we will consider in this chapter is signal strength. Echoes get weaker with time. This affects the images, and requires compensation.
Next, seismic data is colored by filtering.
This filtering can be done in space as well as time.
Time-series analysis involves the concept of
enhancing the signal-to-noise ratio by filtering to suppress
some spectral regions and enhance others.
Spectral weighting can also be used on wavefields in
the space of ![]() and k.
In the absence of noise,
wave-equation theory tells us what filters to use.
Loosely, the wave equation is a filter with a flat amplitude
response in
and k.
In the absence of noise,
wave-equation theory tells us what filters to use.
Loosely, the wave equation is a filter with a flat amplitude
response in ![]() -space and a phase response that
corresponds to the time delays of propagation.
The different regions of
-space and a phase response that
corresponds to the time delays of propagation.
The different regions of ![]() -space have different amounts of noise.
But the different regions need not all be displayed
at the strength proposed by the wave equation,
any more than data must be displayed with
-space have different amounts of noise.
But the different regions need not all be displayed
at the strength proposed by the wave equation,
any more than data must be displayed with ![]() .
.
An example of the mixture of filter theory and migration theory is provided by the behavior of the spatial Nyquist frequency. Because seismic data is often spatially aliased, this example is not without practical significance. Think of an impulse function with its Nyquist frequency removed. The removal has little relative effect on the impulse, but a massive relative effect on the zeroes surrounding the impulse. When migrating an impulse by frequency domain methods, spatial frequencies just below the spatial Nyquist are treated much differently from frequencies just above it. One is treated as left dip, the other as right dip. This discontinuity in the spatial frequency domain causes a spurious, spread-out response in the space domain shown in Figure 1.
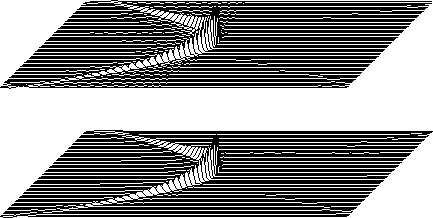 |


The spurious Nyquist noise is readily suppressed,
not by excluding the Nyquist frequency from the display,
but by a narrow band filter such as used in the display, namely
![]() which goes smoothly to zero at the spatial Nyquist frequency.
This filter has a simple tridiagonal representation in the x-domain.
which goes smoothly to zero at the spatial Nyquist frequency.
This filter has a simple tridiagonal representation in the x-domain.