Next: Migration results of the
Up: Biondi: Offset plane waves
Previous: Offset plane-wave downward continuation
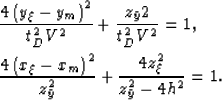
In constant velocity the summation surface of
3-D prestack migration is
|  |
|
| (11) |
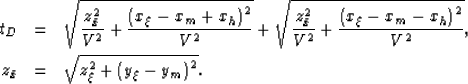
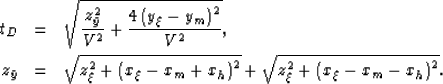
where  are the coordinates of the image point,
(xm,ym) are the midpoint coordinates in data space,
xh is the in-line offset in data space,
tD is recording time in data space,
and V is the medium velocity.
are the coordinates of the image point,
(xm,ym) are the midpoint coordinates in data space,
xh is the in-line offset in data space,
tD is recording time in data space,
and V is the medium velocity.
It is easy to verify that this summation surface is
equivalent to the summation surface defined by the
cascade of the two following expressions:
|  |
(12) |
| (13) |
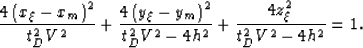
Equation (12) defines the summation
path for 2-D prestack migration and
corresponds to the dispersion relation in
equation (4).
Equation (13) defines the summation
path for 2-D zero-offset migration and
corresponds to the dispersion relation in
equation (5).
The straightforward interpretation of this result
is that two-pass migration, in the correct order,
is equivalent to full prestack migration,
when the velocity is constant.
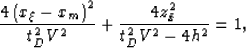
The dispersion relations of offset plane wave migration
[equation (9) and equation (10)]
respectively correspond to the following summation paths
|  |
(14) |
| (15) |
The summation surface of
offset plane wave migration is thus equivalent
the cascade of these two paths.
As noted before, the order of the two migration is reversed
with respect to the correct one,
and thus errors are introduced in the migration
operator.
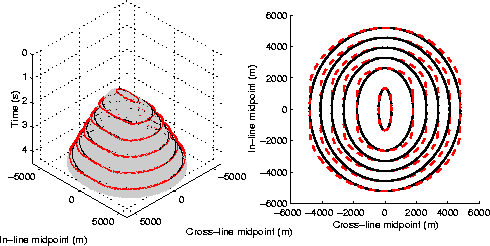
Figure 1
provides an intuitive understanding of the approximations
involved in reversing the order of the migrations.
The grey surface shown
in the left panel of Figure 1
is the summation surface that should be used to image a diffractor
at 500 m depth from data at a constant offset of 4,000 m,
and assuming a constant velocity of 2,500 m/s.
Two sets of contour lines are superimposed onto the surface.
The inner set of contour lines corresponds
to the exact summation surface, while the outer one
corresponds to the surface
defined by cascading the paths defined
in equation (14)
and equation (15).
The right panel of Figure 1
shows the same contour lines in plane view.
The solid lines correspond to the exact summation surface,
while the dashed lines correspond to the approximate summation surface.
Figure 1 graphically demonstrates
that even in constant velocity,
offset plane wave migration introduces an error for
reflectors that are not exactly dipping
in either the in-line direction or the cross-line direction.
planecheops
Figure 1
The grey surface shown in the left panel
is the exact summation surface to image a diffractor
at 500 m depth from data at a constant offset of 4,000 m,
and assuming a constant velocity of 2,500 m/s.
The solid contour lines correspond to the exact summation surface,
while the dashed contour lines correspond to the approximate summation surface.


The analysis of the offset plane
wave migration impulse response, or spreading surface,
provides an alternative perspective to the analysis of the
migration errors.
The spreading surface
of full 3-D prestack migration is the ellipsoid:
|  |
(16) |
It can be split as the cascade of the in-line prestack migration ellipse:
|  |
(17) |
and the cross-line zero-offset semicircle:
| 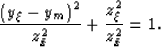 |
(18) |
The impulse response of offset plane wave migration,
as defined by the dispersion relation
in equation (8),
is defined by the cascade of the following two impulse responses
|  |
(19) |
| (20) |
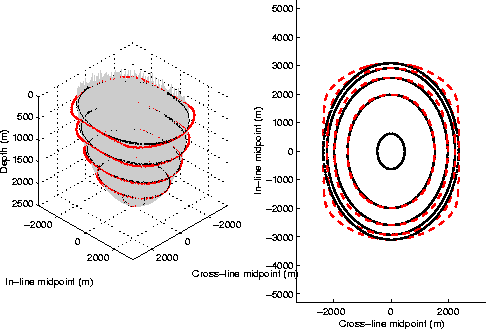
Figure 2 compares
the exact impulse response of 3-D prestack migration
and the offset plane wave approximation.
The grey surface shown
in the left panel of Figure 2
is the exact spreading surface for an impulse recorded
at 2.5 s, at an offset of 4,000 m,
and assuming a constant velocity of 2,500 m/s.
The inner set of contour lines corresponds
to the exact summation surface, while the outer one
corresponds to the surface
defined by cascading the paths defined
in equation (19)
and equation (20).
The right panel of Figure 2
shows the same contour lines in plane view.
The solid lines correspond to the exact spreading surface,
while the dashed lines correspond to the approximate spreading surface.
It is apparent that the approximation is worse for
shallow reflectors dipping at 45 degrees with
respect to the acquisition axes.
This qualitative analysis is confirmed
by the numerical results shown in the next section.
At zero offset the order of the in-line and cross-line migrations
is obviously irrelevant;
it is intuitive that
the errors introduced by reversing the correct migration order
increases with offset.
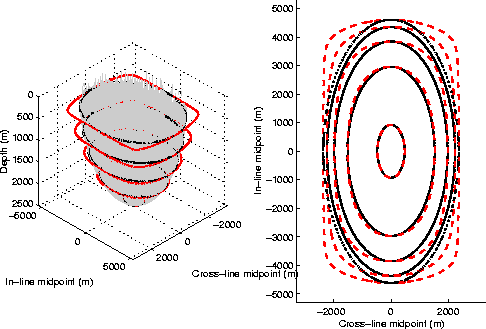
To analyze the errors as a function of offset,
Figure 3 compares
the exact impulse response of 3-D prestack migration
and the offset plane wave approximation
at an offset of 8,000 m,
and assuming the same constant velocity
as in Figure 2 (2,500 m/s).
The left panel of Figure 3
shows the exact spreading surface for an impulse recorded
at 3.73 s.
To make Figure 3 directly comparable with
Figure 2,
the impulse time was chosen to locate the
bottom of the ellipsoid at exactly the same depth
as in Figure 2,
and the contour lines were drawn at the same depths
as in Figure 2.
It is apparent that at constant reflector depth
the errors increase as the offset increases.
planeellips
Figure 2
The grey surface shown in the left panel
is the exact spreading surface for an impulse at
at 2.5 s, an offset of 4,000 m,
and assuming a constant velocity of 2,500 m/s.
The solid contour lines correspond to the exact spreading surface,
while the dashed contour lines correspond to the approximate spreading surface.
planeellips8km
Figure 3
The grey surface shown in the left panel
is the exact spreading surface for an impulse at
at 3.73 s, an offset of 8,000 m,
and assuming a constant velocity of 2,500 m/s.
The solid contour lines correspond to the exact spreading surface,
while the dashed contour lines correspond to the approximate spreading surface.
Next: Migration results of the
Up: Biondi: Offset plane waves
Previous: Offset plane-wave downward continuation
Stanford Exploration Project
10/25/1999