Next: Conclusions/Future Considerations
Up: Gratwick: Imaging using 2-D
Previous: Prestack Migration with P-Wave
Note that the scattering effects of the salt cause much of the P-wave energy to be lost when we are dealing with structures
under the edge of the salt body. Moreover, when we consider the steep dip of the synclinal structure, it is no surprise that
very little P-wave energy gets to the surface from these areas. The next step is then to change the velocity model to stack different
arrivals that have a better chance to make it to the surface Kessinger (1996). These arrivals are the ones that
are from the wavefield that converts
to S-wave through the salt. The interface of the sediment and salt is such that much of converted energy can be produced from
an incident P-wave. Figure 7 shows a ray trace of a wavefield generated on the left flank of the synclinal structure. Note
that the wavefield does not scatter through the salt body, which has the S-wave salt velocity, while the sediment has the P-wave
velocity.
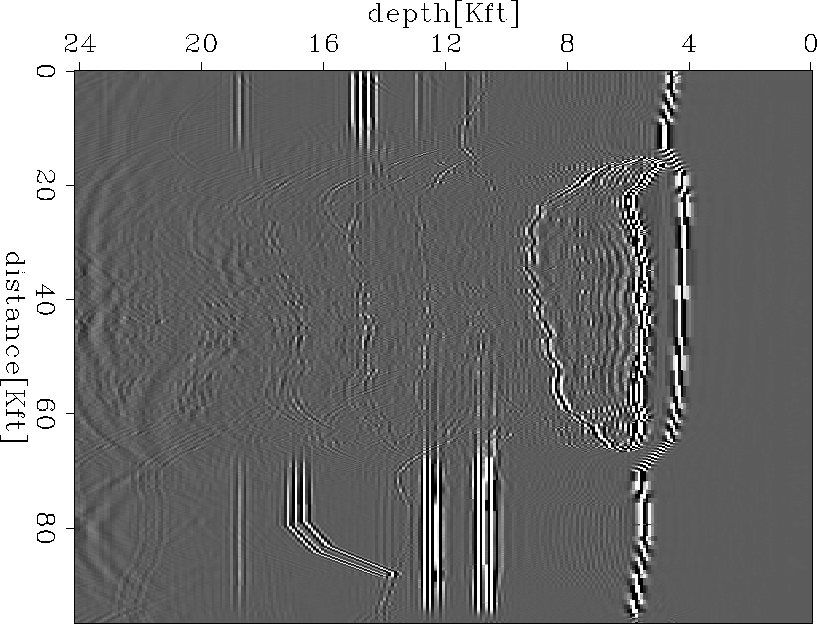
In the migration that used this new velocity model, we can see that enough of this converted wave energy gets
to the receivers that the left flank of the synclinal structure is imaged. Although its amplitude is not very strong, it is enough
that an interpreter would recognize the feature. Note also that the trace below the salt bottom that was seen in the previous
migrated image has moved to its correct subsurface position (Figure 8). Still not imaged well, however, are the leftmost fault blocks
under the salt body, as well as the shadow zone of the lens described in the previous section.
prestack.p.saltlow
Figure 8 Prestack Migrated Section Using P-Wave Velocity Model with Lowered Salt Velocity


Next: Conclusions/Future Considerations
Up: Gratwick: Imaging using 2-D
Previous: Prestack Migration with P-Wave
Stanford Exploration Project
4/27/2000