


The first step in the analysis was to further process the raw data by doing a simple CMP sort.
Ideally, the reciever spacing in a survey (![]() ) should
be twice the shot spacing (
) should
be twice the shot spacing (![]() ). However, the geometry which constrained our modeling (
). However, the geometry which constrained our modeling (![]() =
= ![]() )provides for some headaches in the sorting process Claerbout and Black (1997).
The CMP sorting was based on if the offsets were odd
or even. Even offsets went to even CMP numbers and odd offsets went to odd CMPs. The end result was twice the CMP
sampling with half the traces in each CMP as were in the shot gathers. With 60 shots (spanning 120 m) we ended up
with 159 CMP locations (spanning 159m). There were 20 CMP locations which were fully sampled, that is all their
offsets had trace information. These correspond to the points from 2084m-2104m. This section at zero offset roughly
estimates what a stacked section in this part of the model would look like.
)provides for some headaches in the sorting process Claerbout and Black (1997).
The CMP sorting was based on if the offsets were odd
or even. Even offsets went to even CMP numbers and odd offsets went to odd CMPs. The end result was twice the CMP
sampling with half the traces in each CMP as were in the shot gathers. With 60 shots (spanning 120 m) we ended up
with 159 CMP locations (spanning 159m). There were 20 CMP locations which were fully sampled, that is all their
offsets had trace information. These correspond to the points from 2084m-2104m. This section at zero offset roughly
estimates what a stacked section in this part of the model would look like.
Another problem is the direct wave arrivals for both the P-wave and S-wave. In Figure 11 the direct S-wave cuts across the far receiver traces where AVO effects can be important. Also, these high amplitude primary arrivals can inhibit good velocity analysis. Therefore, a simple velocity mute was used for the CMP gathers to better view the data.
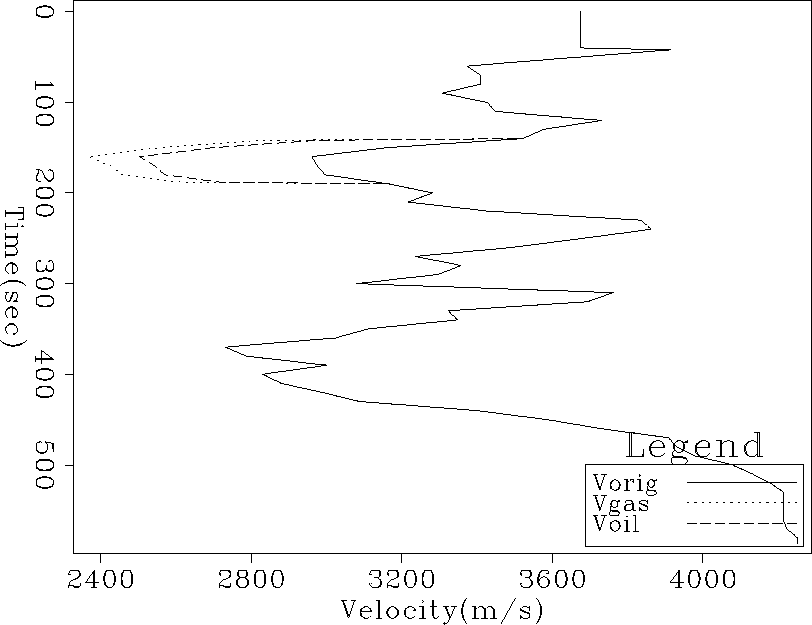 |


It is possible to note in Figure 13, the differences in the P velocity for the sand body selected for the study with the three differents fluid properties after the fluid substitution.
 |
|
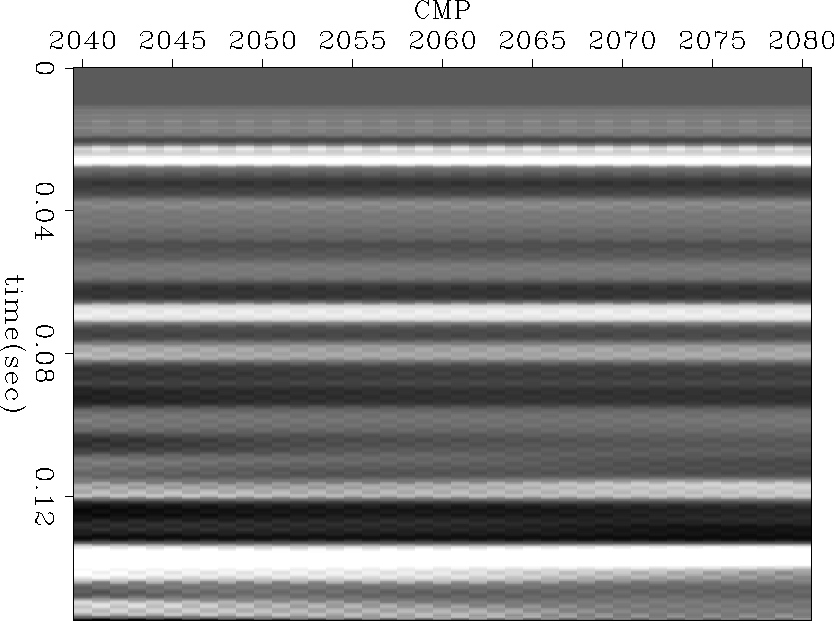
brine_cmp
Figure 15 CMP from brine section at midpoint 2100m. | 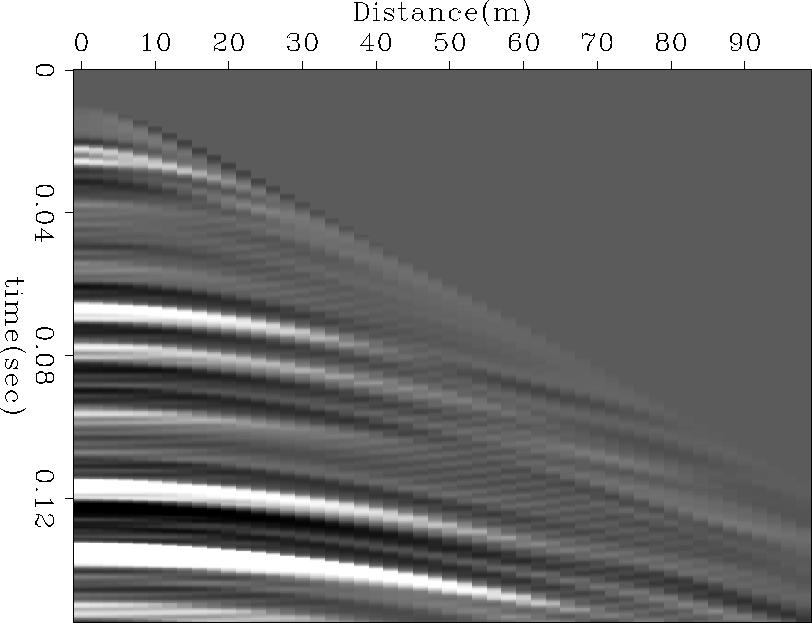 |