Next: Conclusion
Up: Removing data aliasing artifacts
Previous: The frequency domain approach
I implemented this method with synthetic and real data.
The synthetic case perfectly attenuates the aliasing
artifacts. The real data case is not as convincing however, because we
have a dense information in the data space to interpret with
few parabolas in the model space.
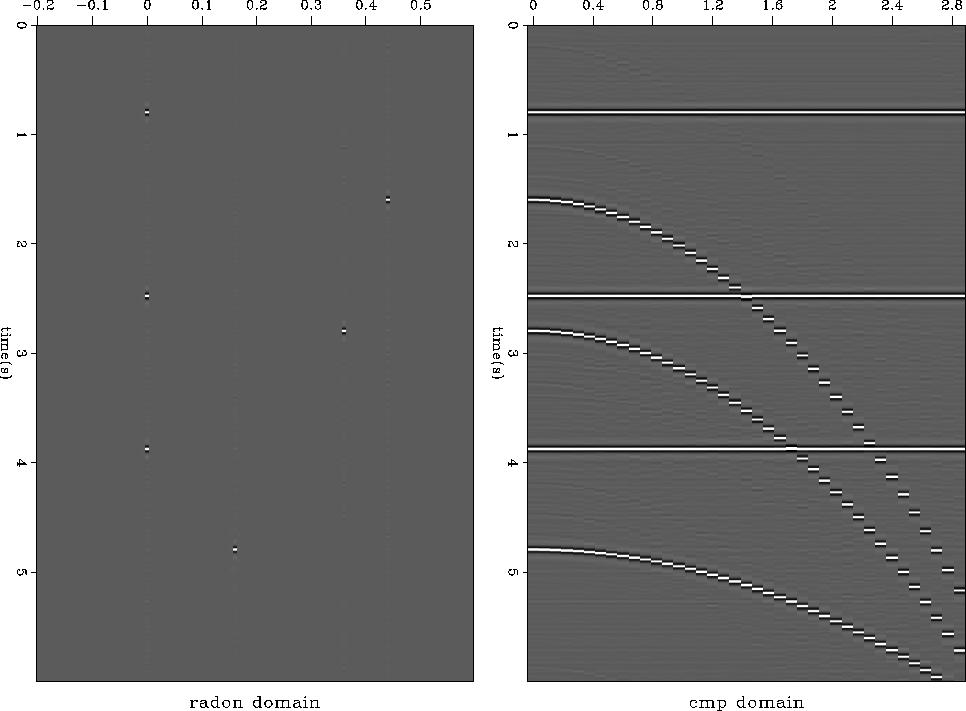
The result with synthetic data is striking (Figure
8):
all the artifacts have disappeared, leaving a clean model space.
The data are almost entirely recovered. Figure
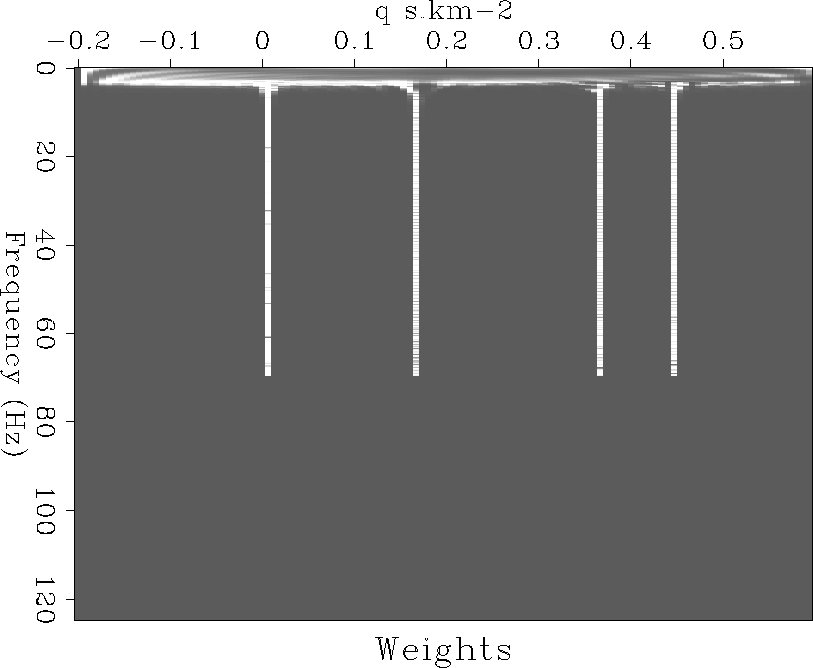
9 displays the diagonal elements
of the matrix  at each frequency. We can see that from
the lowest to the highest frequencies, the diagonal elements focus
at four different locations corresponding to the four parabolic curvatures
present in the input data. The cut-off at 70 Hz which corresponds to the highest
frequency component present in the data, is used to calculate the model space.
at each frequency. We can see that from
the lowest to the highest frequencies, the diagonal elements focus
at four different locations corresponding to the four parabolic curvatures
present in the input data. The cut-off at 70 Hz which corresponds to the highest
frequency component present in the data, is used to calculate the model space.
spikeal
Figure 8 Left: Model space using the
steering matrices. Right: Data reconstructed from the left panel. The
aliasing artifacts are gone, and the focusing in the model space is perfect.


weight
Figure 9 Diagonal elements of the weighting matrix
at each frequency. The four stripes correspond to the location
of the four curvatures in the radon domain. The cutoff at 70 Hz
corresponds to the highest frequency present in the data.
|
|  |
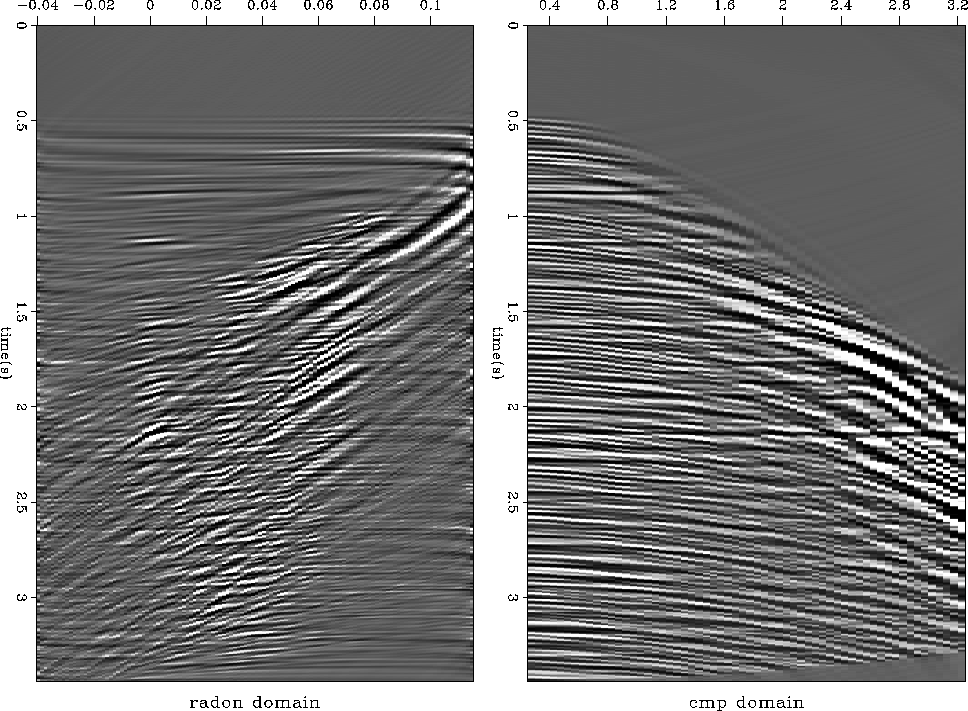
With real data, however, the results suggest strategies to better
focus the radon domain. Figure 10 shows the inversion
of one CMP gather in the parabolic radon domain when no attempt were
made to focus the model space components, that is, no weight in
equation (23).
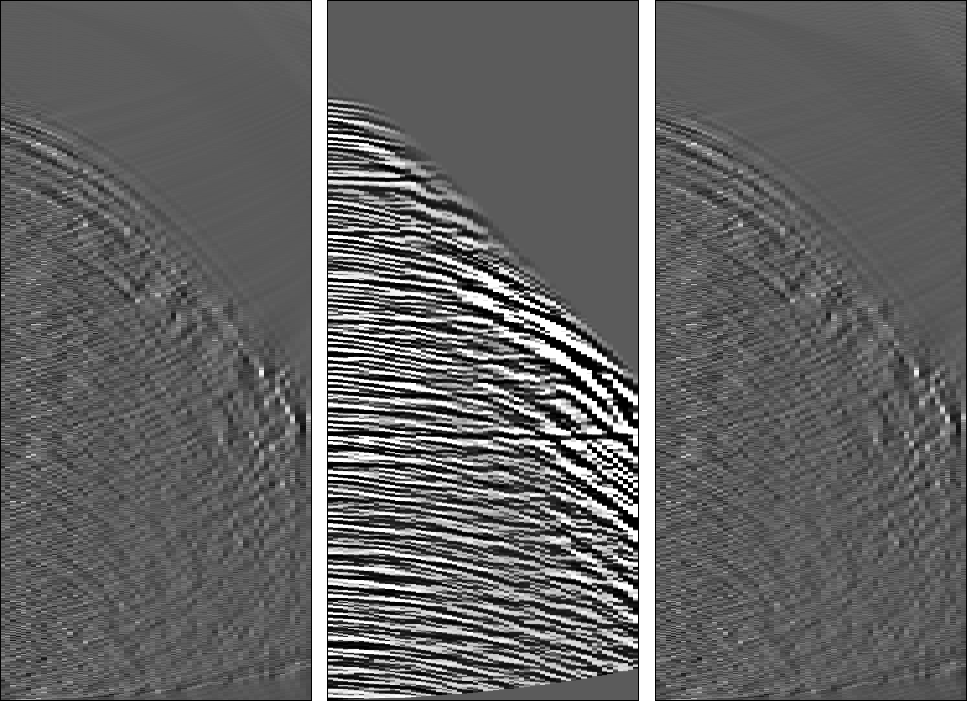
The residual is displayed in the right panel of Figure
12. Although the inversion produces a satisfactory fitting
of the input data, some aliasing artifacts appear in the radon domain.
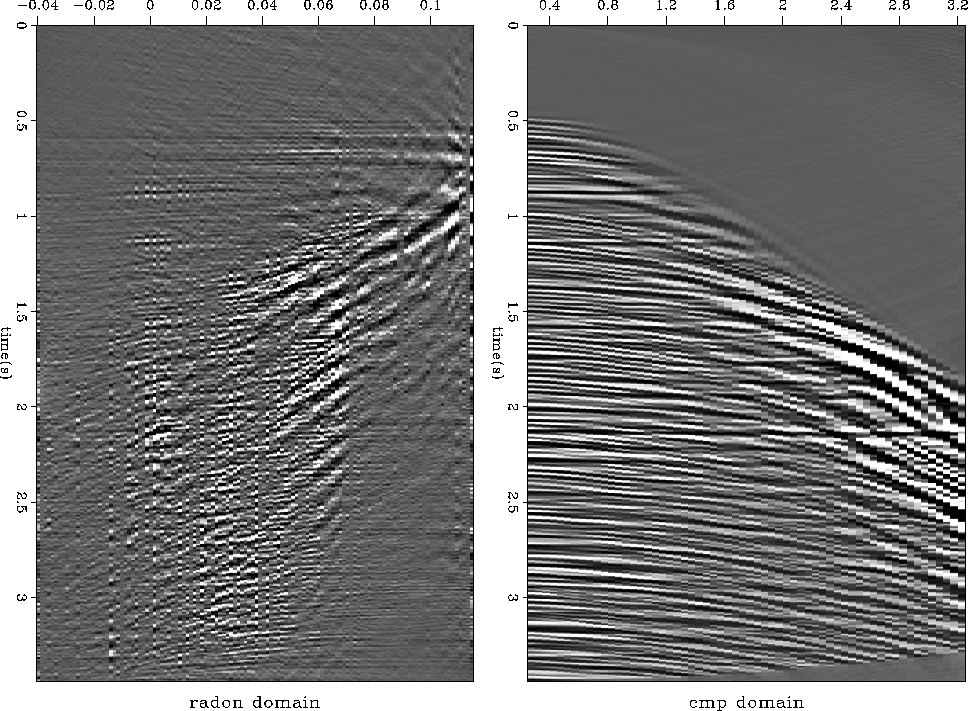
Figure 11 displays the result of the inversion using the
steering-weighting matrices. It shows that fewer artifacts appear in
the radon domain. A comparison of the residual with and without weight
, shown in Figure 12, demonstrates that the data fitting
is satisfactory for both cases. It turns out that
the crucial parameter is  . I don't have any
guideline for choosing it but trial and error. The efficiency of the
steering-weighting matrices method is based on the number of parabolic
events present in the data. The
best results are achieved when few events have to be focused in a
large radon domain. However, since for real data cases this
requirement may be difficult to meet,
I anticipate no or few improvements if we use this method.
One solution may be simply to apply it to different patches as
suggested by Herrmann et al. (2000).
. I don't have any
guideline for choosing it but trial and error. The efficiency of the
steering-weighting matrices method is based on the number of parabolic
events present in the data. The
best results are achieved when few events have to be focused in a
large radon domain. However, since for real data cases this
requirement may be difficult to meet,
I anticipate no or few improvements if we use this method.
One solution may be simply to apply it to different patches as
suggested by Herrmann et al. (2000).
nmo2
Figure 10 Left: A radon domain obtained using
inversion without steering matrices. Right: The reconstructed data.
nmo1
Figure 11 Left: A radon domain obtained using
inversion with steering matrices. Right: The reconstructed data.
comp2
Figure 12 Left: Residual of the inversion
in Figure 10 using the steering matrices. Middle: Input
data. Right: Residual of the inversion in Figure 11
without the steering matrices.
Next: Conclusion
Up: Removing data aliasing artifacts
Previous: The frequency domain approach
Stanford Exploration Project
4/29/2001