Next: Conclusions
Up: Alvarez: Multiple suppression
Previous: Methodology
In order to increase the signal-to-noise ratio of the data for
comparison
purposes ``supergathers'' were created, with each one taken as an average of
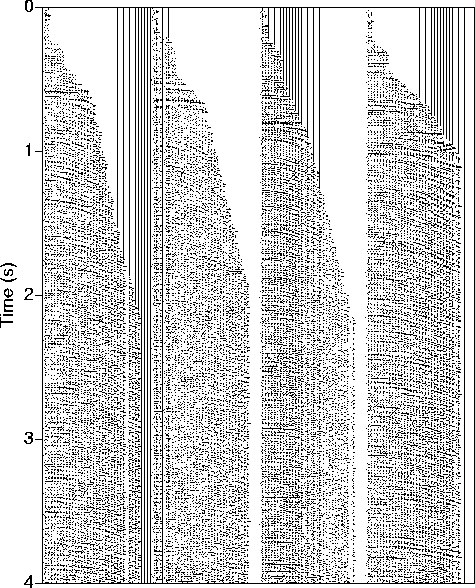
11 consecutive CMP's. Figure 4 shows some of these
supergathers before the multiple
suppression. Notice the almost flat primary reflections and the curved
multiples. Figure 5 shows the same supergathers for
the extracted primaries.
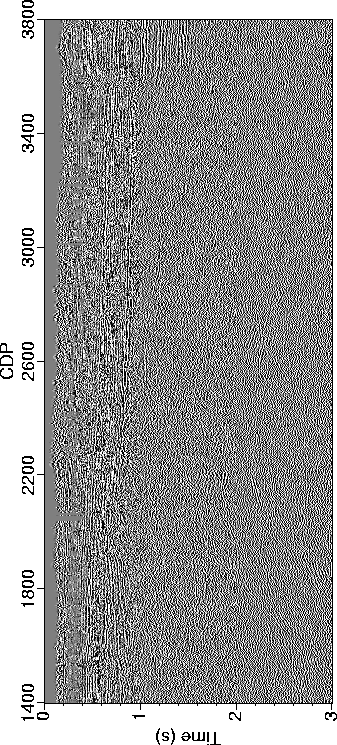
Figure 6 shows the remaining multiples (the plot
amplitude has been amplified
to show the details of the curvature). The extraction of the multiples was
successful except on the shallow part where there are not enough traces to
discriminate between primaries and multiples. Basically the same results were
obtained with all three implementations of the Radon Transform.
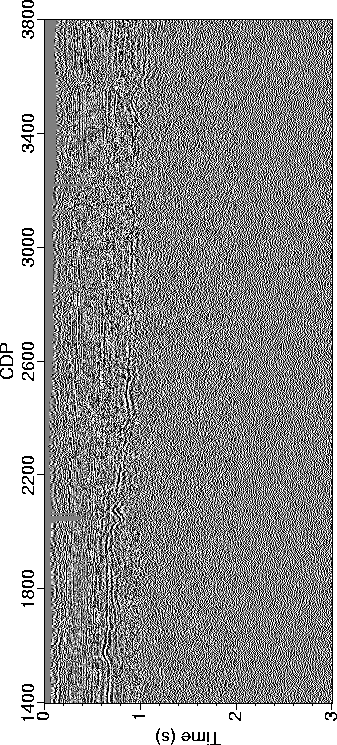
Figure 7 shows the stacked section of the
primary reflections after the
suppression of the multiples. Comparison of this section with
Figure 2 shows that many of the reflections in the original
stacked section
did indeed correspond to multiple reflections. As mentioned before, these
multiple reflections would have been virtually impossible to identify in the
original stacked section. To stress this point, Figure 8
shows an amplified
version of the stacked section for the multiples. Obviously the shallow part
is suspect as explained before, but the deep section shows the most prominent
multiple reflections. If a stacked section such as this were handed to a
seismic interpreter, there is the risk that he could make erroneous
inferences about the subsurface. A more extreme case would be that in which
the NMO correction was performed with the velocity of the multiples, such
as could happen if the multiples (at least some of them) were incorrectly
taken to be primaries.
HR_mul1.agc.SG
Figure 6 Supergathers after multiple
suppression. Residual multiples.

It is important to realize that the suppression of the multiples not
only makes
interpretation easier by highlighting the primaries, but also improves
the resolution of the primaries by allowing a better selection of the primary
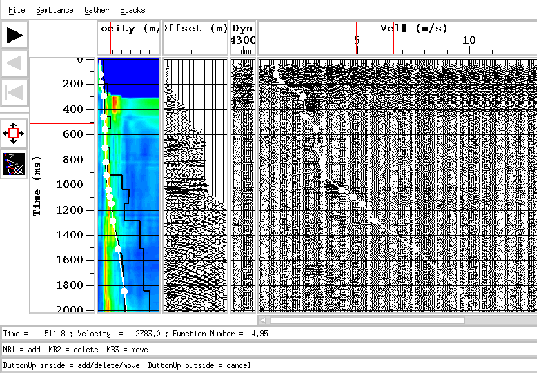
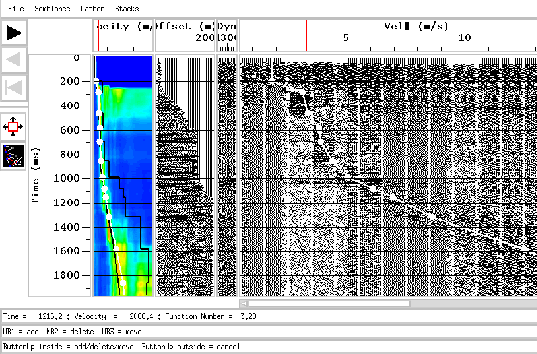
stacking velocities. Figure 9 shows a typical velocity analysis
before the suppression of the multiples, whereas Figure 10
shows
the same velocity analysis after the suppression of the multiple energy. It is
clear that the presence of the multiples masked the velocity trend of the
primaries making it more difficult to select the correct stacking velocity
function appropriate for the NMO correction of
the primaries. By getting rid of the multiples it becomes clear what the
primary stacking velocities should be. The better selection of the primary
velocities improves the image of the stratigraphic features of interest such
as pinchouts of Paleozoic against the basement.
HR_prim_stack1.rot
Figure 7 Stacked section of primaries
only.
HR_mul_stack1.rot
Figure 8 Stacked section of residual
multiples.
velan4
Figure 9 Velocity analysis before multiple
elimination. Notice the multiples at low velocities.
prim_velan2
Figure 10 Velocity analysis after multiple
elimination.
Next: Conclusions
Up: Alvarez: Multiple suppression
Previous: Methodology
Stanford Exploration Project
4/29/2001