


Next: Waterflood diffusion
Up: RESERVOIR MODELS
Previous: RESERVOIR MODELS
The background values and the geometry of the reservoir model are
plotted in Figure ![[*]](http://sepwww.stanford.edu/latex2html/cross_ref_motif.gif) .
The reservoir is 50 m thick and the top of
the reservoir is at 2 km depth. We simulate water injection wells located
at 2 km and 3 km respectively. Table 1 lists the
pre-flood and post-flood petrophysical properties at an injection well.
The background properties both above and below the reservoir are:
Vp = 2.38 km/s, Vs = 1.13 km/s, and
.
The reservoir is 50 m thick and the top of
the reservoir is at 2 km depth. We simulate water injection wells located
at 2 km and 3 km respectively. Table 1 lists the
pre-flood and post-flood petrophysical properties at an injection well.
The background properties both above and below the reservoir are:
Vp = 2.38 km/s, Vs = 1.13 km/s, and  = 2.1 g/cc.
The relative P impedance contrast is calculated as:
= 2.1 g/cc.
The relative P impedance contrast is calculated as:
| 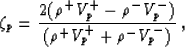 |
(9) |
and similarly for the relative S impedance contrast:
| 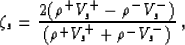 |
(10) |
where ``+'' superscripted properties refer to the layer below the interface,
and ``-'' superscripted properties refer to the layer above the interface.
We note that  and
and  are exactly twice the normal incidence
P and S plane-wave reflection coefficients Rp and Rs:
are exactly twice the normal incidence
P and S plane-wave reflection coefficients Rp and Rs:
|  |
(11) |
|  |
(12) |
Figure shows the depth-dependent form of the background
model and the reservoir properties at an injection well, pre- and post-flood.
Vs is the left-most curve, in the center, and Vp to the right
of each panel.
Table 1:
Reservoir petrophysical properties evaluated at the water injection
well location (a) pre-flood, and (b) post-flood. Vp and Vs
are P and S wave velocities (km/s), is density (g/cc),
Rp and Rs are the normal incidence P and S impedance
plane-wave reflection coefficients at the top of the reservoir.
| 3|c|Reservoir properties |
|
|
|---|
| |
pre-flood |
post-flood |
| Vp |
2.19 |
2.29 |
| Vs |
1.15 |
1.03 |
|
2.05 |
2.09 |
| Rp |
-0.055 |
-0.020 |
| Rs |
-0.003 |
-0.050 |
curves12
Figure 3 Depth-dependent form of the
background model and the reservoir properties at an injection well,
pre- (left) and post-flood (right). Vs is the left-most curve,
in the center, and Vp to the right within each panel. Density is nearly
constant at 2.1 g/cc.


Next: Waterflood diffusion
Up: RESERVOIR MODELS
Previous: RESERVOIR MODELS
Stanford Exploration Project
11/16/1997
