


| |
(1) |
The splitting approximation of the 3-D dispersion relation Brown (1983) is given by
![\begin{displaymath}
{v k_z \over \omega}
= {\left [\sqrt{1 - \frac{v^2k_x^2}{\omega^2}}
+ \sqrt{1 - \frac{v^2k_y^2}{\omega^2}} - 1 \right ] }\end{displaymath}](img4.gif) |
(2) |
The 45-degree approximation of the 3-D dispersion relation with splitting is
 |
(3) |
In Figure 1, the solid line shows
the contours of ![]() for the exact
dispersion relation of equation (1); the dashed line, the splitting
approximation for the 3-D dispersion relation of equation
(2); and
the dotted line, the 45-degree splitting approximation for the 3-D dispersion relation of equation
(3). The splitting approximations show the
familiar anisotropy in relation to the azimuth. The greatest error appears at 45
degree azimuth.
for the exact
dispersion relation of equation (1); the dashed line, the splitting
approximation for the 3-D dispersion relation of equation
(2); and
the dotted line, the 45-degree splitting approximation for the 3-D dispersion relation of equation
(3). The splitting approximations show the
familiar anisotropy in relation to the azimuth. The greatest error appears at 45
degree azimuth.
|
exac-split-45
Figure 1 Contours of constant amplitude and phase for the exact 3-D dispersion relation described in equation (1) (solid line), the splitting approximation in equation (2) (dashed line), and the 45-degree approximation to splitting in equation (3) (dotted line). | 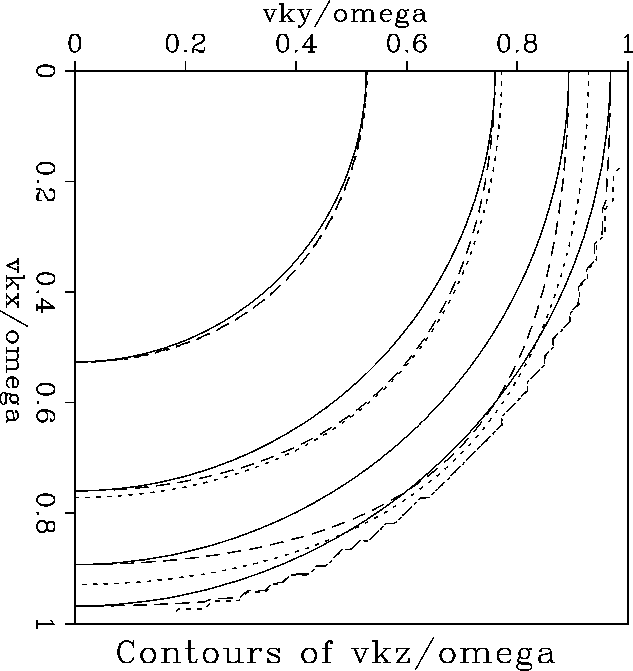 |


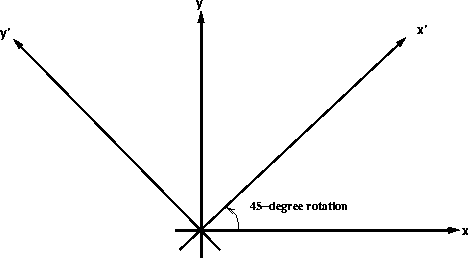
After an azimuth rotation of 45 degrees, as shown in Figure ![[*]](http://sepwww.stanford.edu/latex2html/cross_ref_motif.gif) ,
the 45-degree approximation for
the split 3-D dispersion relation
can be obtained as follows:
,
the 45-degree approximation for
the split 3-D dispersion relation
can be obtained as follows:
 |
| (4) |
| (5) |
where kx' and ky' are the new axes after
a rotation by angle ![]() . For
. For ![]() degrees, substituting the
following relations
degrees, substituting the
following relations
| (6) |
| (7) |
into Equation (3) gives
 |
(8) |
Figure 3 shows the contours of ![]() for the
45-degree approximation, with an azimuth rotation of 45 degrees (the
dashed line)
and without (the solid line).
The curves of the two approximations have
their greatest errors at different
places. For the one without rotation,
the worst error is at the 45 degree azimuth;
for the one with 45 degree rotation,
the worst error is along x and y axes.
Therefore, the average of the two should
give us a more isotropic operator.
for the
45-degree approximation, with an azimuth rotation of 45 degrees (the
dashed line)
and without (the solid line).
The curves of the two approximations have
their greatest errors at different
places. For the one without rotation,
the worst error is at the 45 degree azimuth;
for the one with 45 degree rotation,
the worst error is along x and y axes.
Therefore, the average of the two should
give us a more isotropic operator.
|
rot-45
Figure 3 Contours of constant amplitude and phase for the 45-degree splitting approximation described in equation (3) (solid line) and the rotated 45-degree splitting approximation in equation (8)(dashed line). | 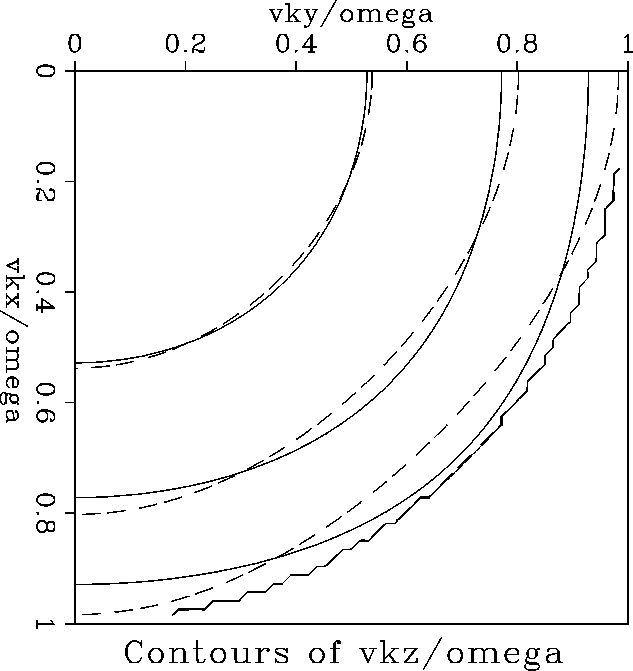 |
The operator obtained by averaging equation (3) and (8) gives
![\begin{displaymath}
{v k_z \over \omega}
= {1\over2} {\left [{2 - {\frac{{v^2 \o...
...y)^2}
{2 - \frac{v^2(-k_x + k_y)^2 }{4\omega^2}}}
}\right ] }\end{displaymath}](img14.gif) |
(9) |
In Figure , the solid line indicates the contour for the
exact 3-D dispersion
relation equation (1); the dot-dashed line,
the four-pass operator of equation
(9). The dispersion relation for the four-pass method
looks isotropic but has an error that increases with dip, which is
caused by the 45-degree approximation.
|
exac-rotavg
Figure 4 Contours of constant amplitude and phase for the exact 3-D dispersion relation described in equation (1) (solid line) and the averaged 45-degree splitting approximation obtained from the four-pass operator, as in equation (9)(dotted line). | 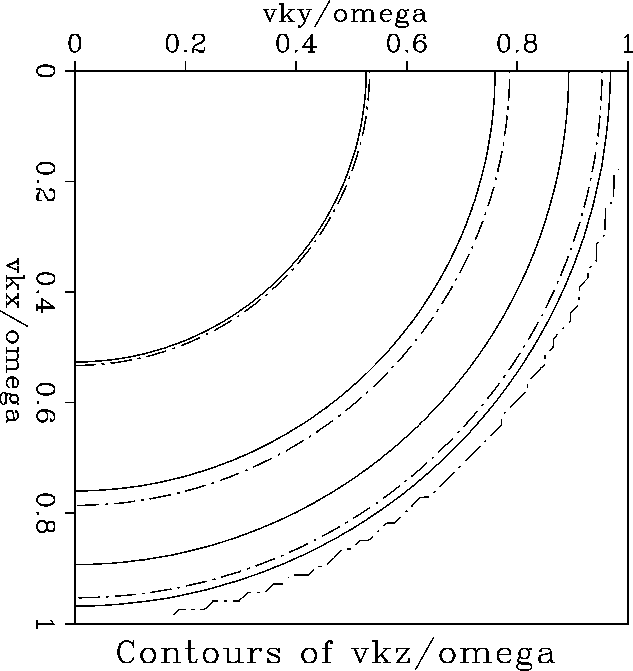 |