


The Marmousi velocity model (Figure ![[*]](http://sepwww.stanford.edu/latex2html/cross_ref_motif.gif) ) generates
complex propagation paths in which late energetic arrivals are not fit well
by first-arrival finite-difference traveltimes.
In Figures through , a
modeling program written by Martin Karrenbach (1995)
is used to generate snapshots
of the acoustic wavefield from two surface locations in the Marmousi
model. The corresponding contours of first-arrival traveltime have been
overlaid. These contours are from the first-arrival traveltime
tables used for Kirchhoff datuming and migration later in this chapter.
) generates
complex propagation paths in which late energetic arrivals are not fit well
by first-arrival finite-difference traveltimes.
In Figures through , a
modeling program written by Martin Karrenbach (1995)
is used to generate snapshots
of the acoustic wavefield from two surface locations in the Marmousi
model. The corresponding contours of first-arrival traveltime have been
overlaid. These contours are from the first-arrival traveltime
tables used for Kirchhoff datuming and migration later in this chapter.
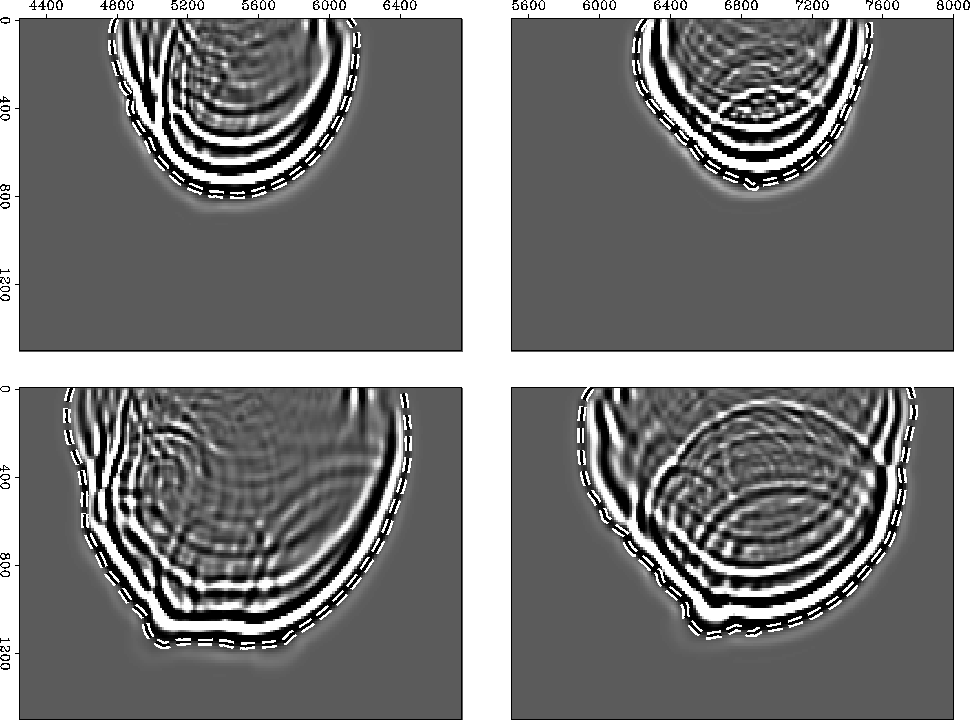
At the early-time snapshots displayed in Figure ,
the first-arrival contours overlay the energetic portions of the
wavefield nicely.
This is because there
has not been enough time for adverse propagation effects to develop fully.
Since the first-arrival traveltime matches the high energy portions of the
wavefield, using these traveltimes for Kirchhoff migration
will result in good imaging at these early times.
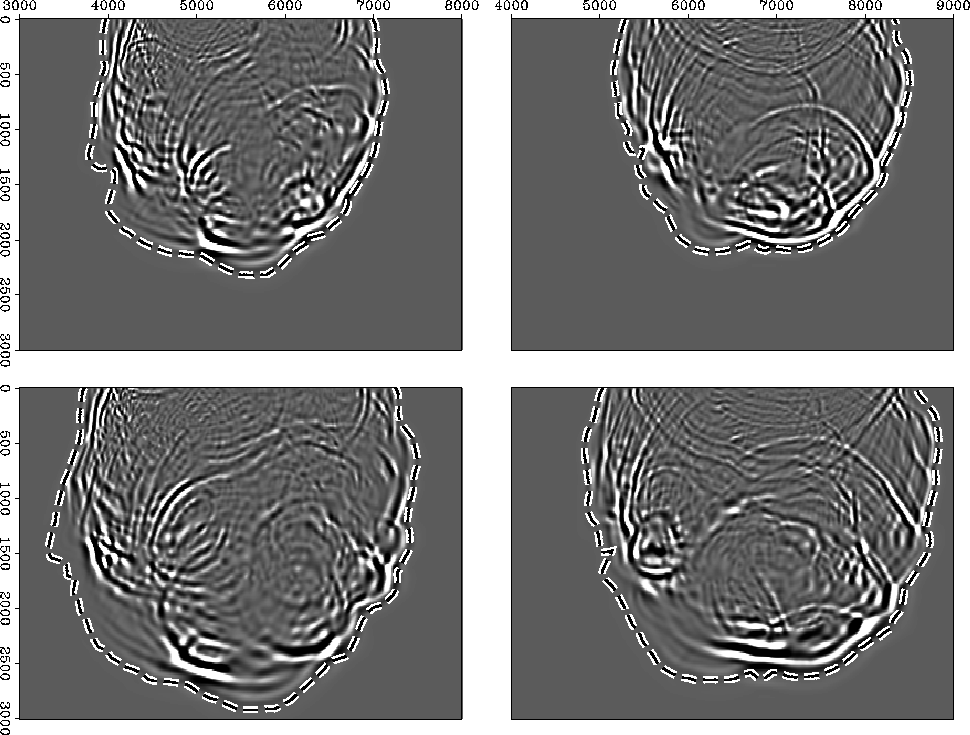
In contrast, snapshots for the same source locations
at later times of 0.9 s and 1.05 s (Figure ) show
that the first-arrival traveltimes do not always correspond
to energetic portions of the wavefield. If these traveltimes were
used for migration, the resulting image would suffer because
parts of the summation trajectories would not correspond to
energetic arrivals. This last sequence of two figures demonstrates
that as the wavefield evolves, complex propagation effects begin
to manifest themselves, and the first-arrival traveltimes no longer match
the most energetic wavefront.
Figure is generated by
starting the acoustic modeling and the first-arrival traveltime
calculation from a depth of 1500 m. The 0.2 s and 0.3 s contours
correspond nicely
to the high energy portions of the wavefields. There is some deviation
in the shallow part of the lower left 0.3 s panel, but for the most part,
the first-arrival traveltime contour fits the bulk of the acoustic
energy very well. The pulling away of the first-arrival traveltime contour
represents a
headwave propagating along the thin high velocity layer that
starts under the fault at lateral position of about 5500 m and a depth
of 1500 m in Figure .
Overall, the contours in Figure and
have not pulled away from the energetic wavefront
as they have in Figure .
This shows that if traveltime calculation is limited to
early times, the first-arrival traveltimes accurately parameterize the
most energetic portions of the acoustic wavefield.
 |
![[*]](http://sepwww.stanford.edu/latex2html/movie.gif)


 |
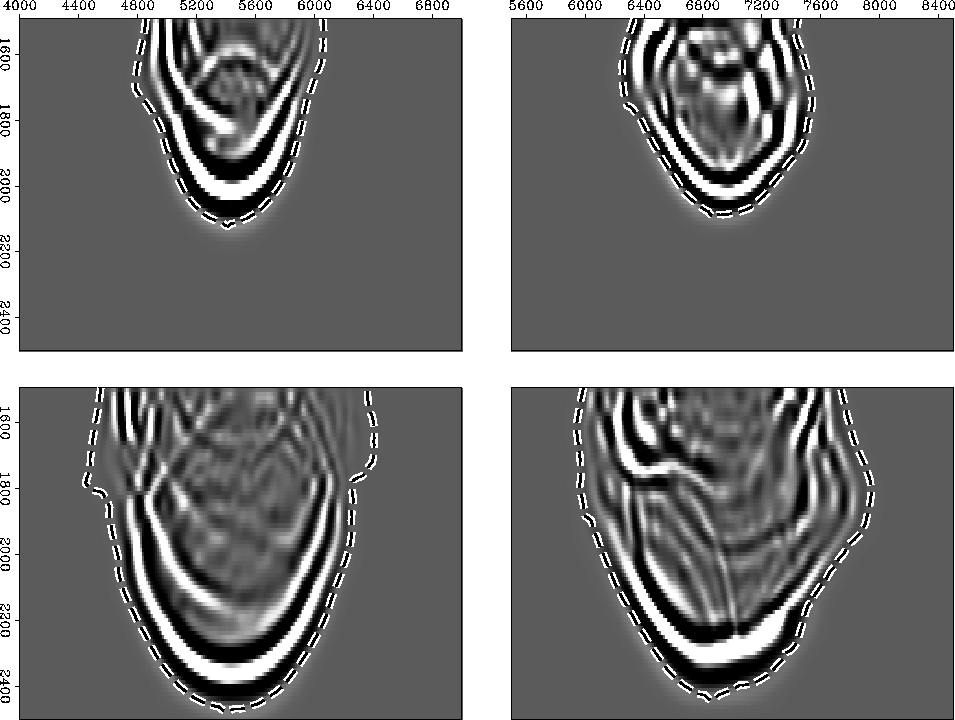 |
and
but with sources at a depth of 1500 m.
The top two panels are at a time of 0.2 s
and the bottom two are at a time of of 0.3 s.