
![[*]](http://sepwww.stanford.edu/latex2html/prev_gr.gif)


ABSTRACTThe periodogram (i.e., the square of the Fourier transform) of a time series generally provides a poor estimate of the spectrum if that spectrum has a wide dynamic range. So the spectrum of any process that includes either one or many resonant modes (sharp peaks) can be expected to be poorly computed by such elementary means. Multitaper spectral analysis is a nonparametric method designed to provide a rigorous method of resolving the spectrum of such complex processes. There are some practical difficulties with this method, such as deciding what tapers to use and how many, that can make the method some what difficult for the uninitiated user. Another approach to spectral analysis is the parametric method known as autoregressive (AR) analysis (related but not identical to maximum entropy spectral analysis). AR analysis can be used to approximate the dominant modes in the spectrum, remove them from the time series and thus prewhiten the remaining time series, thereby eliminating the main problem with analysis based on the periodogram. Furthermore, if the main purpose of the spectral analysis is to determine the number and location of the modes, the AR method provides a set of parameters that can be used to describe the mode structure if desired. The present paper provides a set of examples comparing the use of both the multitaper method and the autoregressive method for analyzing the same (long) time series data. We find that both methods give very comparable results in these examples, thus providing a type of empirical cross-validation showing that both methods are therefore doing an excellent job of estimating the true spectrum of the time series. |
INTRODUCTION
The notion of a spectrum of light dates at least from the time of Newton's experiments with prisms and Rowland's experiments with diffraction gratings in which white light is split into its component spectra. However, the notion of a spectrum in acoustics is much older, dating at least from the time of Pythagoras (6th Century B.C.) and the musical scale he developed.
The quantitative analysis of acoustical spectra can be accomplished by taking the Fourier transform of the acoustical time series and squaring it. The resulting function of frequency is often called the ``periodogram'' for the historical reason that it was first plotted, not as a function of frequency but rather, as a function of period. The total energy in a time series is just the integral of the square of the amplitude over time. The periodogram provides a measure of the relative energy contained at each frequency in the power spectrum. For real data with noise, the periodogram, although very well-known, is nevertheless a notoriously bad method of estimating the spectrum Percival and Walden (1993); Yuen and Fraser (1979). Windowing methods Blackman and Tukey (1958) were developed to reduce and control the erratic behavior observed in the periodogram. The idea of using multiple windows (or ``tapers'' as they are now called) and then averaging (i.e., stacking in the frequency domain) has arisen in the last 20 years Thomson (1982); Yuen and Fraser (1979). Multitaper analysis has proven to be a very effective means of producing reliable spectra and also of analyzing the statistical properties of these spectra. We will use long time series, both experimental and simulated, of helioseismic data (sound waves in our Sun) to compare and contrast the multitaper methods to autoregressive methods of spectrum estimation.
Millions of acoustic waves are stochastically excited in the solar
convection zone. Those waves travel through the inner layers of the sun,
and thus carry information about the conditions of the solar
interior. Precise estimation of the many different oscillation
mode parameters is therefore crucial in understanding the physical
processes of the inner sun. The estimation procedure involves many
steps but can be briefly summarized as follows: first, Doppler
velocity images of the visible solar disk are taken, then the images
are decomposed into time series of spherical harmonic coefficients,
then the spectrum of each individual series identified by the
spherical harmonics ``quantum'' numbers ![]() and
and ![]() is
estimated. The spectrum estimation is usually done nonparametrically
in the Fourier space. This paper proposes autoregressive (AR)
modeling in the time domain as an alternative to the nonparametric
methods. Considering an AR model has several justifications:
pure sinusoidal variations can be expressed as AR models, and, any
continuous spectral density function can be arbitrarily well
approximated by AR models of high enough order.
is
estimated. The spectrum estimation is usually done nonparametrically
in the Fourier space. This paper proposes autoregressive (AR)
modeling in the time domain as an alternative to the nonparametric
methods. Considering an AR model has several justifications:
pure sinusoidal variations can be expressed as AR models, and, any
continuous spectral density function can be arbitrarily well
approximated by AR models of high enough order.
Two datasets are analyzed in the next sections: the actual Global
Oscillation Network Group's (GONG) GONG (1997) Month 10 (T=51840
values from 1996/03/26 to 1996/04/30) ![]() and
and ![]() series, and an artificially simulated one that contains the same
number of observations as the actual data.
series, and an artificially simulated one that contains the same
number of observations as the actual data.
The paper is organized as follows: The autoregressive (AR) model is presented in the next section. Then, methods for selecting the order of the AR process are discussed, followed by descriptions and comparison of three different methods of estimating the parameters of an AR process. Checks on the validity of the AR model assumptions are presented, and then the AR modeling is used to estimate the spectrum by prewhitening the spectrum of the original series. A brief description of a robust nonparametric spectrum estimation procedure (multitapering) is then presented, and the final section compares AR and nonparametric spectrum estimates. Based on these data, the analyses suggest that the AR method and the multitapering method result in very similar spectrum estimates for the long time series considered in the paper.
THE AUTOREGRESSIVE MODEL
The zero mean stationary process ![]() is an autoregressive process
of order p, denoted AR(
is an autoregressive process
of order p, denoted AR(![]() ), if it satisfies the following
equation:
), if it satisfies the following
equation:
| |
(1) |
The spectral density function of such a stationary AR(![]() ) model
has the form:
) model
has the form:
| |
(2) |
| |
(3) |
There are generally two steps in the estimation procedure: first,
determine the order ![]() of the process (which is usually
unknown), and second, given that order, estimate the
of the process (which is usually
unknown), and second, given that order, estimate the ![]() parameters.
parameters.
ORDER SELECTION
Of the various procedures proposed in the statistical literature to select the order of an AR model, see Percival and Walden 1993 and references therein, the partial autocorrelation- and the Akaike's information criteria (AIC) methods are used in this paper. Orders selected by the Bayes' information criterion (BIC) are also calculated and compared to the ones selected by the AIC.
The Partial Autocorrelation Method
This order selection procedure is based on the simple observation that
for an AR(![]() ) process, the partial autocorrelation sequence
) process, the partial autocorrelation sequence
![]() is zero for lags
is zero for lags ![]() greater than
greater than ![]() .
Assuming a Gaussian noise source, approximate confidence limits for
the partial
autocorrelation coefficients can be set. The order
.
Assuming a Gaussian noise source, approximate confidence limits for
the partial
autocorrelation coefficients can be set. The order ![]() can then
be chosen by looking at the partial autocorrelation plot (
can then
be chosen by looking at the partial autocorrelation plot (![]() versus the lag
versus the lag ![]() ). See
Ripley and Venables (1996). The estimates
). See
Ripley and Venables (1996). The estimates ![]() are
derived by solving the Yule-Walker equations, obtained by multiplying
both sides of (1) by Xt+k, then taking expectations.
The result is:
are
derived by solving the Yule-Walker equations, obtained by multiplying
both sides of (1) by Xt+k, then taking expectations.
The result is:
| |
(4) |
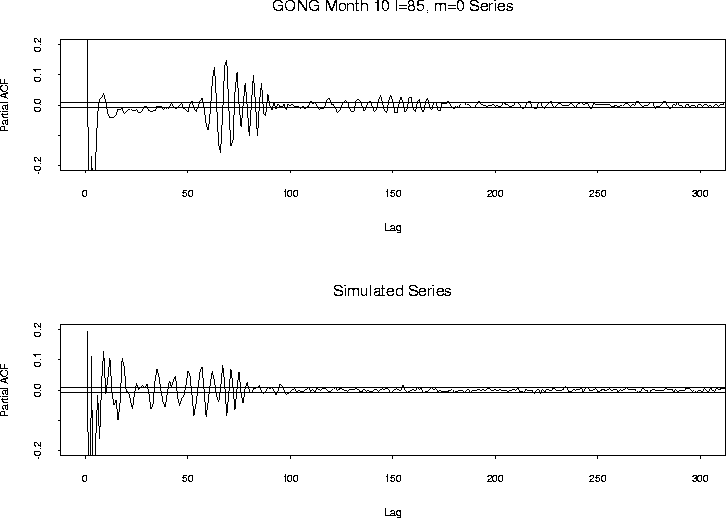
The estimated partial autocorrelation functions for the GONG Month 10
l = 85, m = 0 data and for a synthetic dataset are plotted on
Figure 1. The figures only include terms up to lag
500. The behavior of both functions is the same for greater lags,
mainly all the estimated coefficients
fall between the rough 95% confidence bands, and so they are
omitted for the clarity of the pictures. The horizontal lines giving
the normal confidence limits are at ![]() , see
Kay and Makhoul 1983 T=51840. Note that the terms corresponding
to the second lags are -0.85, and -0.86 for the GONG and for the
simulated data correspondingly, but again, the axes limits are
truncated so that the rest of the pictures is clearer. Based on these
crude diagnostics, the upper limits for the order
, see
Kay and Makhoul 1983 T=51840. Note that the terms corresponding
to the second lags are -0.85, and -0.86 for the GONG and for the
simulated data correspondingly, but again, the axes limits are
truncated so that the rest of the pictures is clearer. Based on these
crude diagnostics, the upper limits for the order ![]() of 200
for the GONG data and 150 for the simulated data seem sensible.
Beyond those lags, assuming normality, at the 95% confidence level,
the null hypotheses that all the partial autocorrelation coefficients
are zero cannot be rejected.
of 200
for the GONG data and 150 for the simulated data seem sensible.
Beyond those lags, assuming normality, at the 95% confidence level,
the null hypotheses that all the partial autocorrelation coefficients
are zero cannot be rejected.
 |

Akaike's Information Criterion
Given that the maximum AR orders to consider are 200, and 150
respectively for the GONG and for the simulated data, are there any
lower order AR models that are just as ``good'', or even ``better''
than the maximum order models? One standard frequently used in the
statistical literature to evaluate the goodness of a model and to
compare models of different sizes is the AIC criterion.
Heuristically, the higher the order of the process, the less the
noise process variability, but the higher the number of parameters
to estimate. Any continuous spectrum can be approximated
with a large enough order AR model [see Anderson 1971], but there
is a limit to how many parameters can be well estimated from the data.
The task is to find a relatively low order model that has a small
enough noise process variance estimate. Mathematically, the AIC
criterion for an AR(![]() ) process is defined as:
) process is defined as:
| |
(5) |
To select among competing models, the AIC criterion is first computed for the various models with different orders, and then the model with the least AIC value is selected as the ``best'' model. Throughout this paper, normal likelihoods are assumed.
Figure 2 shows the AIC(![]() ) values versus orders
less than or equal to the highest orders chosen in the previous subsection.
The very first plot includes all the orders considered for the GONG
data: there is clearly a huge drop in the AIC value at the third
order, then another large drop from around order 60 to around 90, then
a very slight decrease around order 150, then apparently the plot
levels off. The second plot of the top panel presents the section of
the first plot between orders 160 and 200. The AIC values drop
continually until order 192 then they start to increase. Note
however, the almost flat portion of the AIC for orders between 175 and
195. The performances of the different AR models with orders in that
range are probably very comparable. The minimum of the AIC is
achieved at order 192.
) values versus orders
less than or equal to the highest orders chosen in the previous subsection.
The very first plot includes all the orders considered for the GONG
data: there is clearly a huge drop in the AIC value at the third
order, then another large drop from around order 60 to around 90, then
a very slight decrease around order 150, then apparently the plot
levels off. The second plot of the top panel presents the section of
the first plot between orders 160 and 200. The AIC values drop
continually until order 192 then they start to increase. Note
however, the almost flat portion of the AIC for orders between 175 and
195. The performances of the different AR models with orders in that
range are probably very comparable. The minimum of the AIC is
achieved at order 192.
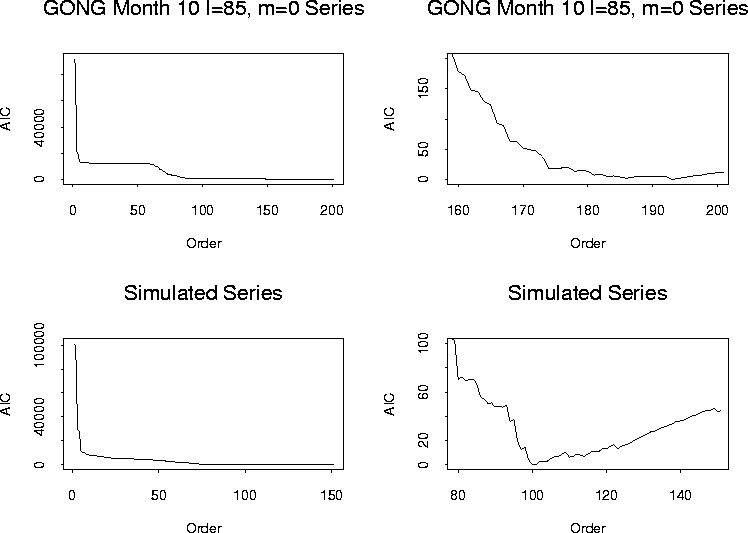 |
The two plots of the bottom panel illustrate the simulated data AIC. Again, the first figure shows the AIC versus all the lags, in this case up to 150, and the second one only a section around the minimum AIC value. The selected order for this process is 99.
A very similar alternative method to the AIC is the BIC. The BIC objective functional has a slightly different form:
| |
(6) |
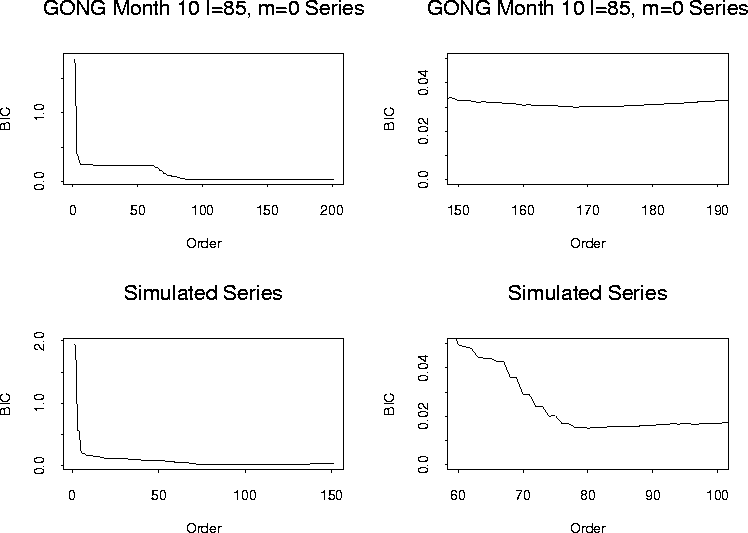 |
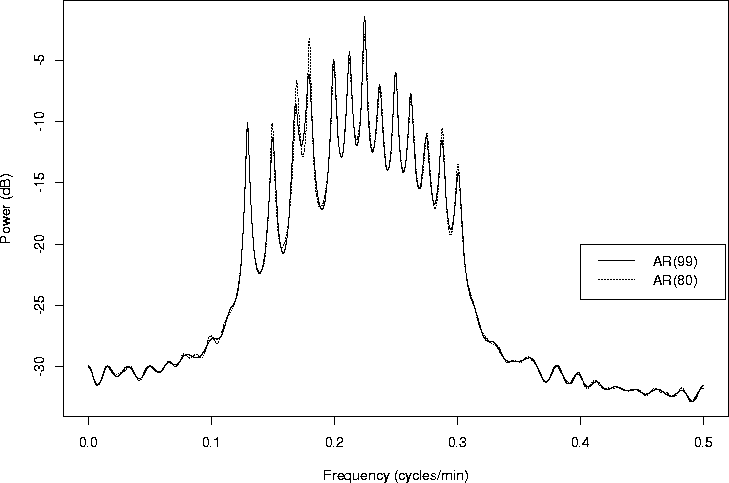
As a comparison of models with order selected by the AIC and by the BIC, Figure 4 overlaps the AR(99) and the AR(80) model for the simulated data.
 |
AUTOREGRESSIVE PARAMETER ESTIMATION
There are various ways of estimating the parameters of an AR(![]() ) process, once the order of the process is selected.
This paper compares the performance of three different methods of
computing the AR coefficients: solving the Yule-Walker
equations Percival and Walden (1993), using Burg's algorithm
Burg (1975), and using Marple's algorithm Marple (1980).
) process, once the order of the process is selected.
This paper compares the performance of three different methods of
computing the AR coefficients: solving the Yule-Walker
equations Percival and Walden (1993), using Burg's algorithm
Burg (1975), and using Marple's algorithm Marple (1980).
The Yule-Walker Equations
The oldest way of estimating the parameters of an AR(![]() )process is by substituting the
)process is by substituting the ![]() nonzero autocorrelation
function estimates given by
nonzero autocorrelation
function estimates given by
| |
(7) |
The straightforward matrix algebra solution to the ![]() simultaneous equations requires the inversion of a
simultaneous equations requires the inversion of a ![]() by
by ![]() matrix, and thus can become computationally intensive. The
Levinson-Durbin algorithm to solve the Yule-Walker equations explores
the Toeplitz
structure of the matrix to be inverted, and thus solves for the AR
parameters more efficiently. It also cuts the execution time by
requiring only O(p2) operations, as opposed to the brute-force
matrix inversion which requires O(p3) operations. Chapter 9 of
Percival and Walden (1993) describes the algorithm in detail.
matrix, and thus can become computationally intensive. The
Levinson-Durbin algorithm to solve the Yule-Walker equations explores
the Toeplitz
structure of the matrix to be inverted, and thus solves for the AR
parameters more efficiently. It also cuts the execution time by
requiring only O(p2) operations, as opposed to the brute-force
matrix inversion which requires O(p3) operations. Chapter 9 of
Percival and Walden (1993) describes the algorithm in detail.
A common objection to estimating the AR parameters with the
Yule-Walker equations is the use of the biased autocorrelation
estimates ![]() of (7) in (4):
substituting the unbiased versions, T-|k| instead of T in the
denominator, causes numerical instabilities in the estimation
algorithm. Note, however, that better autocorrelation estimates than
the ones in (7), like tapered estimates, can be used. The
only requirement is that the estimated autocorrelation matrix be
positive definite. Chapter 9 of Percival and Walden (1993) is a again a
good reference.
of (7) in (4):
substituting the unbiased versions, T-|k| instead of T in the
denominator, causes numerical instabilities in the estimation
algorithm. Note, however, that better autocorrelation estimates than
the ones in (7), like tapered estimates, can be used. The
only requirement is that the estimated autocorrelation matrix be
positive definite. Chapter 9 of Percival and Walden (1993) is a again a
good reference.
Burg's Algorithm
Burg argues that knowing ![]() autocorrelation coefficients is not
sufficient to identify a process uniquely. Based on
autocorrelation coefficients is not
sufficient to identify a process uniquely. Based on ![]() known
autocorrelation coefficients, in Burg 1967 he proposes to choose
the spectrum of the most random process among all processes whose
autocorrelations up to order
known
autocorrelation coefficients, in Burg 1967 he proposes to choose
the spectrum of the most random process among all processes whose
autocorrelations up to order ![]() agree with the known
autocorrelations. However, generally there is no way of knowing a
priori the autocorrelation coefficients. Burg 1975
proposes an alternative to the Levinson-Durbin recursions of
solving for the AR coefficients: an alternative that unlike the former
method does not assume that the process is zero outside the sampling
interval. The algorithm is as computationally efficient as the
Levinson-Durbin method. The merits and shortcomings of this algorithm
are detailed by Percival and Walden 1993. For short series,
Lysne and Tjostheim 1987 and
Ulrych and Clayton 1976 claim that the Burg
method produces more realistic estimates than the Yule-Walker method.
agree with the known
autocorrelations. However, generally there is no way of knowing a
priori the autocorrelation coefficients. Burg 1975
proposes an alternative to the Levinson-Durbin recursions of
solving for the AR coefficients: an alternative that unlike the former
method does not assume that the process is zero outside the sampling
interval. The algorithm is as computationally efficient as the
Levinson-Durbin method. The merits and shortcomings of this algorithm
are detailed by Percival and Walden 1993. For short series,
Lysne and Tjostheim 1987 and
Ulrych and Clayton 1976 claim that the Burg
method produces more realistic estimates than the Yule-Walker method.
Marple's Algorithm
Marple's least squares algorithm Marple (1980); Ulrych and Clayton (1976) estimates the AR parameters by minimizing the sum of the forward and backwards prediction error squares. Its computational complexity is comparable to the complexity of the Levinson-Durbin, and of the Burg algorithms. Marple (1987) and Kay (1988) argue that Marple's algorithm outperforms both the Yule-Walker and the Burg algorithm. Rather than relying on the AIC or other order selection methods, Marple defines two new selection criteria: one based on the ratio of the residual prediction error energy to the total signal energy, the other based on the ratio of the residual prediction error energy at order k to the the residual prediction error energy at order k-1. The estimation procedure stops at order p if either the first or the second criterion is less than the corresponding user specified tolerance level. Marple suggests using both tolerance levels between 10-2 and 10-3. Following those recommendations however, setting both cutoffs to 10-2 in the simulated dataset, results in selecting the order p = 6. The spectrum estimate based on that order only shows 2 peaks whereas in reality there should be 13 peaks. Only by decreasing the first tolerance to 10-4 and the second one to 10-5 does the estimated order increase to a level (p = 108 ) that captures the true structure of the underlying process. The spectrum estimate based on p = 108 and on the AR coefficients calculated with the Marple routine is barely distinguishable from the estimate obtained using the AIC selected p = 99 and coefficients calculated with the Yule-Walker equations.
Based on the artificial data, the AIC (or BIC) order selection
methods appear to be more reliable than those suggested by Marple. To
estimate the AR coefficients with the Marple method, first the
tolerances are tuned to force the order selection to the
order ![]() selected by the AIC criterion. For the synthetic
dataset, the values of the two tolerances that guarantee the selected
order to be 99 are 0.13366 and 10-5, correspondingly.
selected by the AIC criterion. For the synthetic
dataset, the values of the two tolerances that guarantee the selected
order to be 99 are 0.13366 and 10-5, correspondingly.
Comparing the Methods
First, the order of the process is determined via the AIC, then the coefficients are estimated in the previously described three fashions. The results for the simulated dataset are compared in Figure 5.
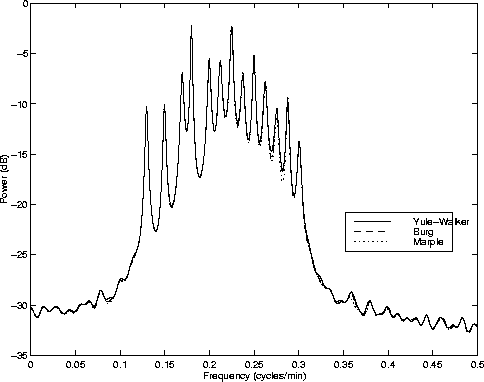 |
Qualitatively and quantitatively, the three spectrum estimates seem very similar. Figure 6 magnifies the details of the previous plot in the range of the known generating frequencies. Vertical lines are added at the exact locations of those 13 frequencies. As the plot shows, the three AR spectrum estimates agree to a high degree of accuracy - however, all three of them seem to be slightly biased at some of the frequencies, especially at the peaks located at the highest and lowest frequencies in the band.
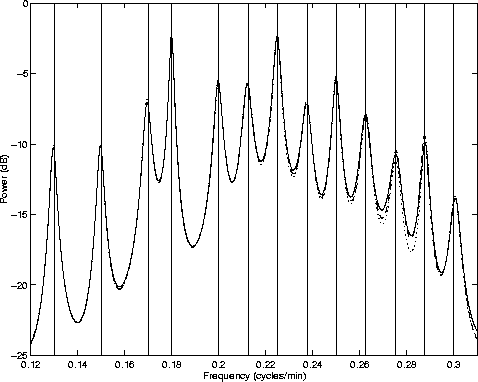 |
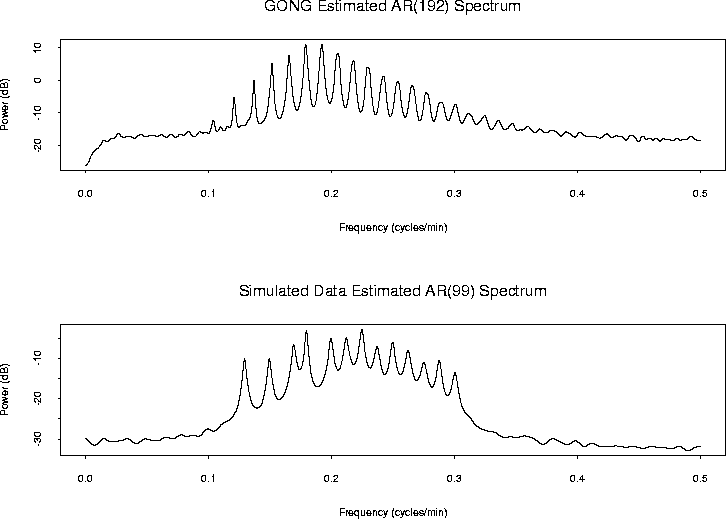
Figure 7 illustrates the estimated AR spectra for the GONG and for the simulated data, both with orders estimated with the AIC, and using the Yule-Walker equations. The simulated data were generated as the superposition of 13 different sinusoidal modes; clearly, the estimated AR(99) spectrum does indicate the presence of 13 frequencies.
 |
MODEL CHECKING
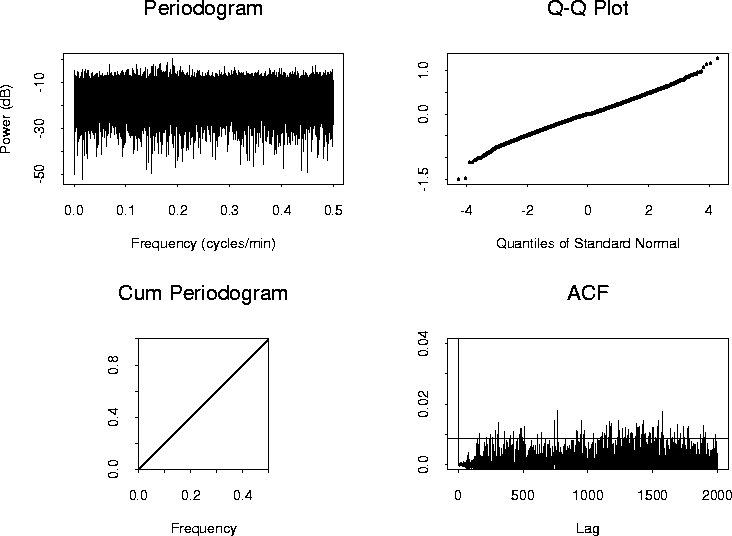
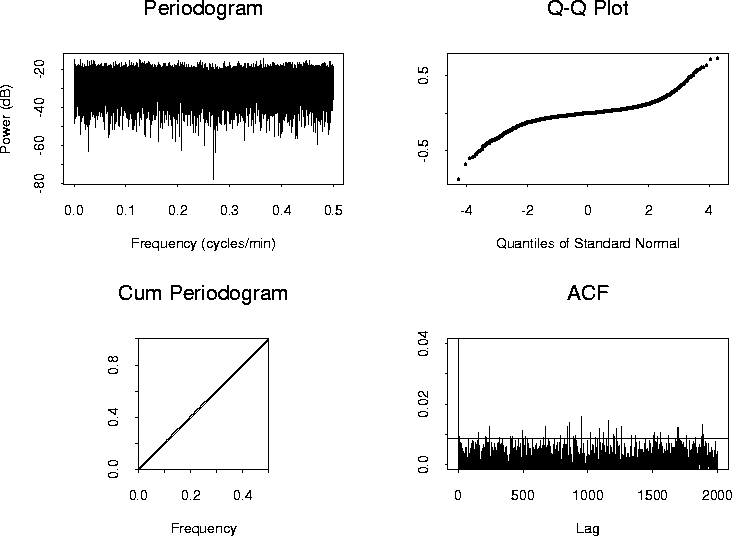
The four plots of Figure 8 present the periodogram, the quantile-quantile (qq) plot versus the standard normal distribution, the cumulative periodogram, and the estimated autocorrelation function for the residuals from the AR(192) model fitted to the GONG data. The relative flatness of the periodogram suggests a white noise process. Note however, the dynamic range of the process: most of the power is between about -30 and -10 decibels, but with extreme values ranging from -50 to -5 decibels.
The qq plot indicates that, apart from a few outliers, the empirical distribution of residuals seems to be consistent with a normal distribution. The cumulative periodogram tests for Gaussian white noise using the Kolmogorov-Smirnov goodness of fit test Conover (1980). As the normalized periodogram values fall between the upper and lower limits, there is not sufficient evidence at the 95% significance level to reject the null hypothesis of white noise.
The estimated residual autocorrelation function plot, however, suggests that the residuals are correlated at many lags.
 |
Similar diagnostics for the simulated data are shown on Figure 9. In this case the spectrum is white again, but the qq plot indicates departure from normality. As in the GONG data case, the residuals are correlated.
 |
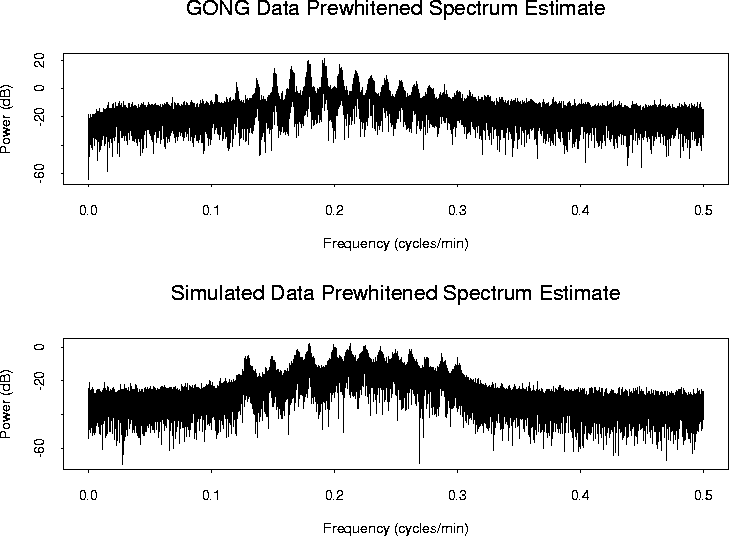
AUTOREGRESSIVE MODELING AS PREWHITENING FILTER
The pure parametric approach of AR modeling requires strong indications that the process under investigation is truly an AR process. If such an assumption is questionable, AR modeling can still be of use as a prewhitening filter. If the original process has high dynamic range, then power leakage can bias the classical nonparametric spectral estimates. A means of controlling the bias is to prewhiten the series: construct a new series that is a linear filtered version of the original series such that the new one has smaller dynamic range. Then estimate the spectrum of the new series in a nonparametric way, say using direct spectral estimators, and finally use the theory of linear filters to construct a spectrum estimate of the original series based on the spectrum estimate of the filtered series. The main difference between this combined parametric and nonparametric approach and the pure parametric approach is that while the latter assumes a white residual noise process, the former actually estimates the residual spectrum in a nonparametric way. The AR order selection is not as crucial in the former approach as it is in the latter; in the combined procedure the nonparametric part is actually able to compensate for any inaccuracies caused by the parametric part. In the pure AR case, however, the right order selection can be very important; studies suggest that being off just by a couple of orders can lead to very different final spectrum estimates.
Suppose an AR(![]() ) model is fit to the data. Call the resulting
parameter estimates
) model is fit to the data. Call the resulting
parameter estimates ![]() and
and
![]() . Then form the residual series as:
. Then form the residual series as:
| (8) |
 |
(9) |
 |
(10) |
 |
MULTITAPERED SPECTRUM ESTIMATES
The previous sections describe the pure parametric and the mixed parametric and nonparametric approaches to spectrum estimation, both methods assuming, to some degree at least, that the process under study is a realization of an AR process. In this section, the results of a purely nonparametric spectral estimation procedure are presented.
Suppose one is interested in estimating the spectrum S(f) of a zero
mean, stationary random process ![]() . The general multitaper
estimate based on the realization x0, x1, ... , xT-1 is of the
form:
. The general multitaper
estimate based on the realization x0, x1, ... , xT-1 is of the
form:
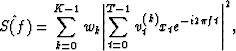
where ![]() for k=0,
... ,
K-1 are K tapers. The estimate above is a combination of K
eigenspectrum estimates. The wk are the corresponding weights the
individual tapered estimates get in the final multitapered
version. The simplest version of multitapering is to use equal
weights w = 1/K.
for k=0,
... ,
K-1 are K tapers. The estimate above is a combination of K
eigenspectrum estimates. The wk are the corresponding weights the
individual tapered estimates get in the final multitapered
version. The simplest version of multitapering is to use equal
weights w = 1/K.