


 |

 |
 |
 |
 |
For Huber to be a serious competitor to the l2 norm and the CG, it needs to be stable
with respect to the number of iterations and to the Huber threshold, ![]() . This is
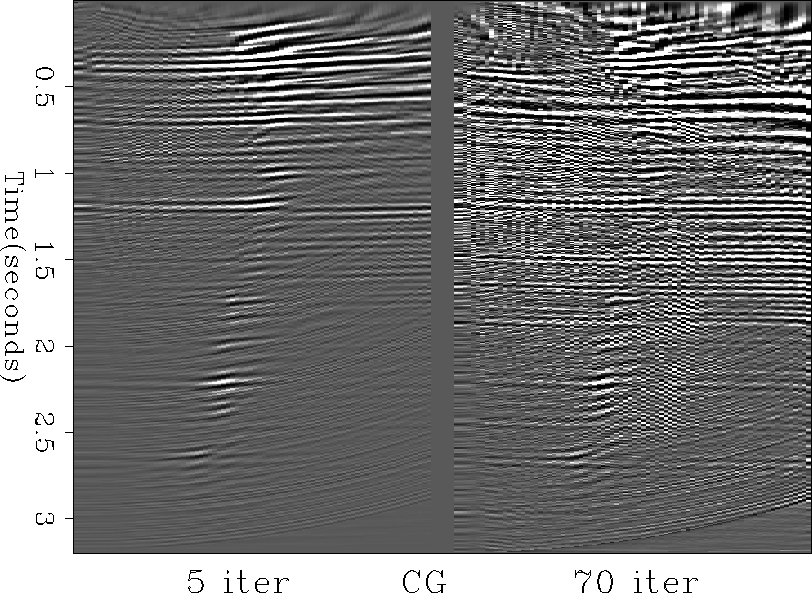
what we investigate in this section. Figure14 displays two velocity panels using
5 and 70 CG iterations on input A. The right panel shows one of the well known characteristics of the conjugate
gradient: after a relative small number of iterations, the algorithm starts to invert noise in
the data space, making the model space particularly messy and uninterpretable.
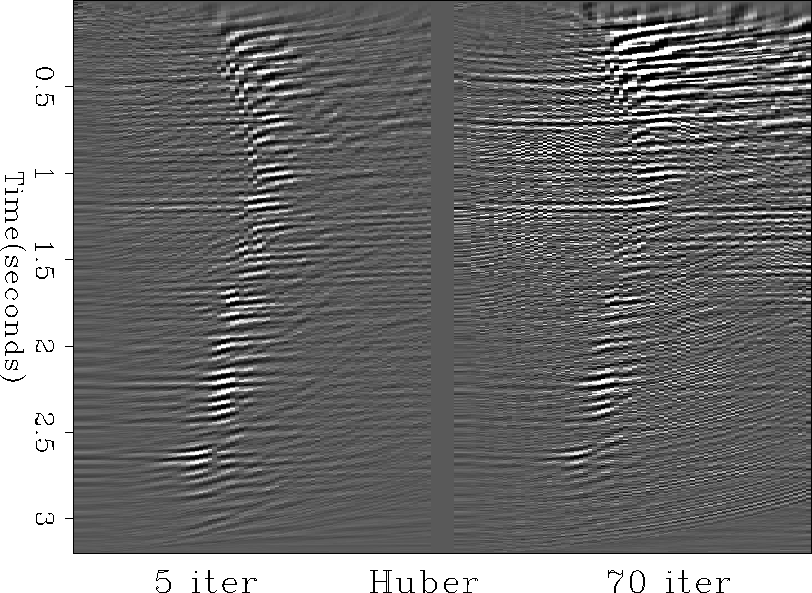
In contrast, the Huber results are fairly stable
(Figure15) since we can pick a reasonable velocity function without
bothering with the noise. Some artifacts appear, however, which may be squelched by moving up or down the threshold.
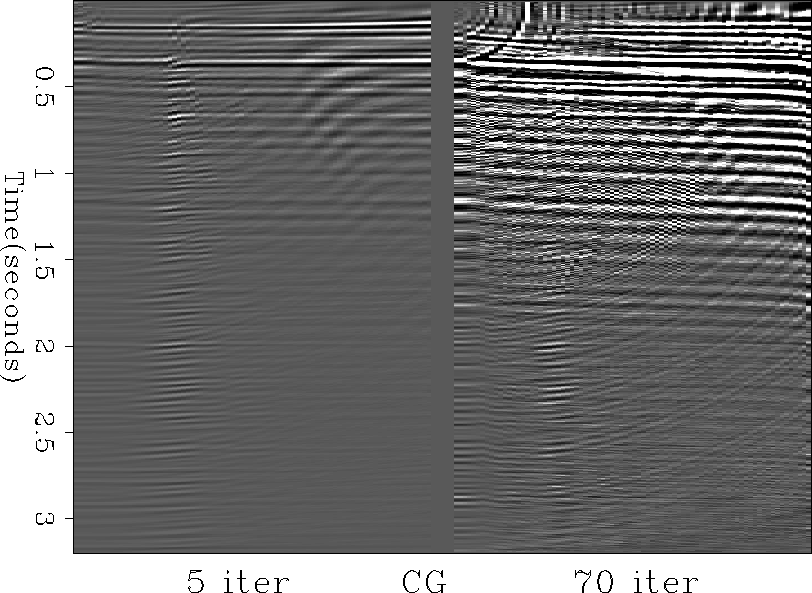
The next result is by far the most favorable to Huber (Input B).
Figure16 shows two velocity functions after 5 and 70
iterations using conjugate gradient.
The noise level is so strong after 70 iterations that we cannot distinguish any coherent feature. Once again,
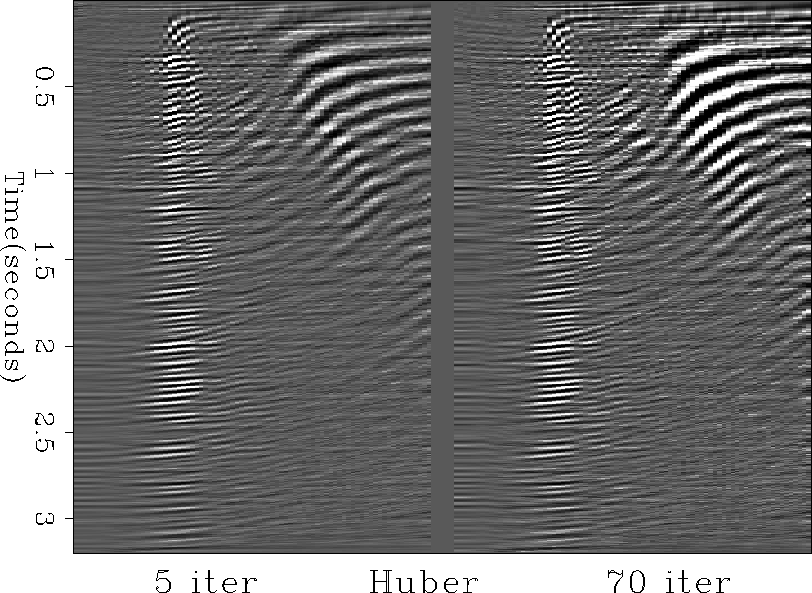
the Huber solver gives a better velocity panel (Figure 17). This is a major
improvement to the performance of CG.
. This is
what we investigate in this section. Figure14 displays two velocity panels using
5 and 70 CG iterations on input A. The right panel shows one of the well known characteristics of the conjugate
gradient: after a relative small number of iterations, the algorithm starts to invert noise in
the data space, making the model space particularly messy and uninterpretable.
In contrast, the Huber results are fairly stable
(Figure15) since we can pick a reasonable velocity function without
bothering with the noise. Some artifacts appear, however, which may be squelched by moving up or down the threshold.
The next result is by far the most favorable to Huber (Input B).
Figure16 shows two velocity functions after 5 and 70
iterations using conjugate gradient.
The noise level is so strong after 70 iterations that we cannot distinguish any coherent feature. Once again,
the Huber solver gives a better velocity panel (Figure 17). This is a major
improvement to the performance of CG.
Testing the Huber response for different thresholds is another important issue.
Remember that this threshold determines the border between the l1 and
l2 norms. Ideally, we would like not to have to specify this parameter
a priori, but rather have the algorithm adaptively estimates it from the data.
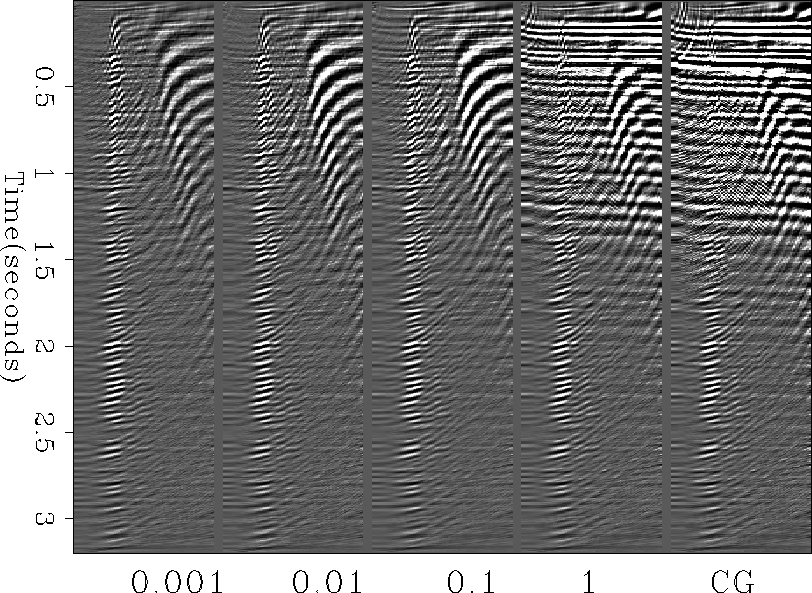
It's interesting, however, to test the system's sensitivity to the threshold. Figure 18
shows a comparison for ![]() ranging from 0.001 to 1 for 20 iterations.
The last panel is the CG result. As expected, Huber starts to behave like an
l2 norm for large
ranging from 0.001 to 1 for 20 iterations.
The last panel is the CG result. As expected, Huber starts to behave like an
l2 norm for large ![]() . Nonetheless, for
. Nonetheless, for ![]() to
to ![]() ,the velocity panels are fairly comparable giving us a wide range of possibilities in the choice of the threshold.
,the velocity panels are fairly comparable giving us a wide range of possibilities in the choice of the threshold.