


Some petrophysical parameters were carefully chosen to generate a synthetic model that simulates a geopressure zone Dutta (1987); Mavko et al. (1998). Figure 4 displays the velocity model used. At 3 km, it is possible to see a strong velocity change that identifies the geopressure zone. This velocity anomaly is visible in Figure 5 at 2.3 sec where a polarity inversion occurs.
|
model
Figure 4 Depth velocity model for a geopressure zone. | 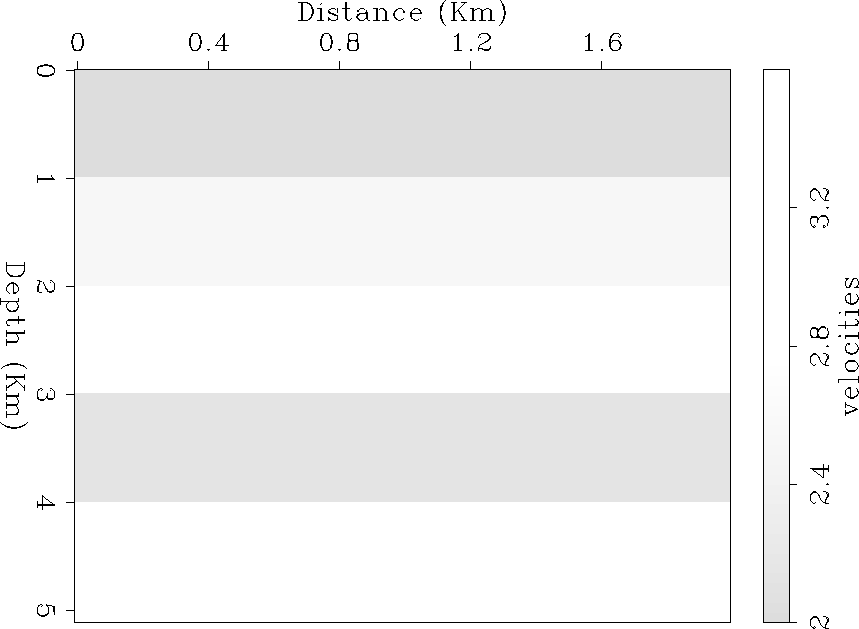 |


|
synt-inv
Figure 5 Synthetic gather simulating a geopressure zone. | 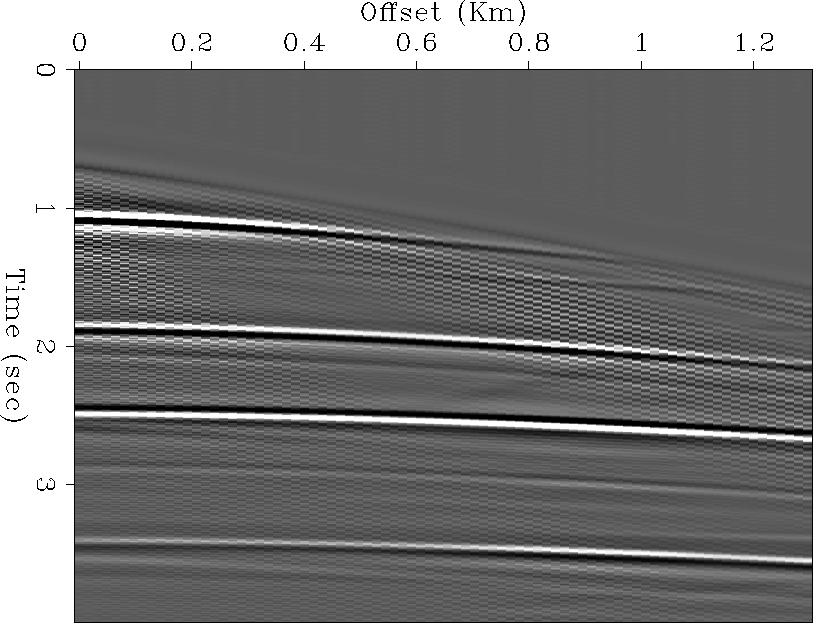 |
Figure 6 shows the velocity analysis of this synthetic and the picked RMS. Finally, Figure 7 exhibit a comparison of the interval velocity obtained with the inversion method, the picked RMS velocity and the remodeled RMS velocity.
|
scan-inv
Figure 6 Velocity analysis for the second synthetic example. The curve is the picked RMS velocity. | 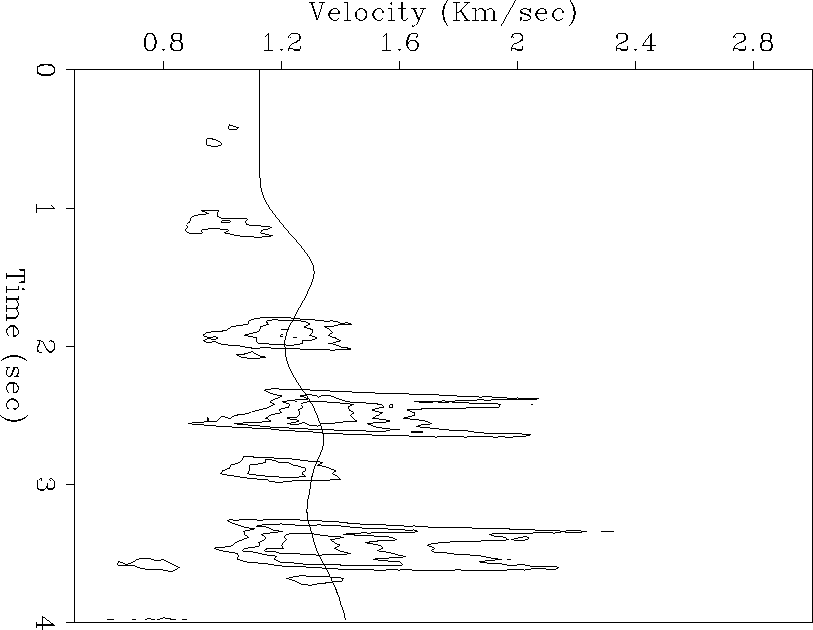 |
|
compar-inv
Figure 7 Comparison of interval velocity and RMS velocities. | 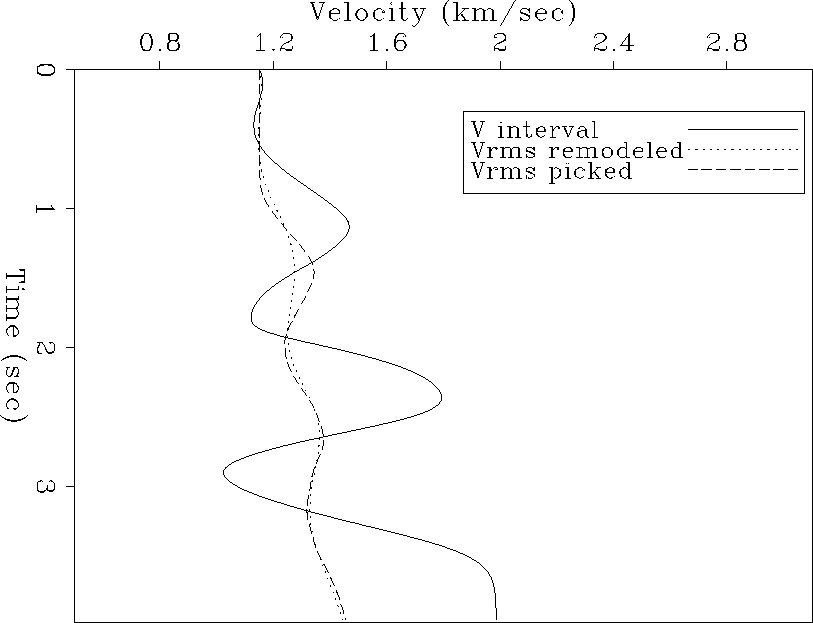 |