Next: Multiple
Up: R. Clapp: Multiple realizations
Previous: and
A relatively simple, but more realistic, example
is estimating interval velocities  from RMS velocities
  .Clapp et al. (1998) did this by taking advantage of
the linear relation between
.Clapp et al. (1998) did this by taking advantage of
the linear relation between  and
and  .We can keep our interval velocities relatively smooth
by adding a roughening operator
.We can keep our interval velocities relatively smooth
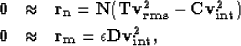
by adding a roughening operator  .The fitting goals then become
|  |
|
| (13) |
where  is causal integration and
  is
the result of causal integration with a vector of ones.
is
the result of causal integration with a vector of ones.
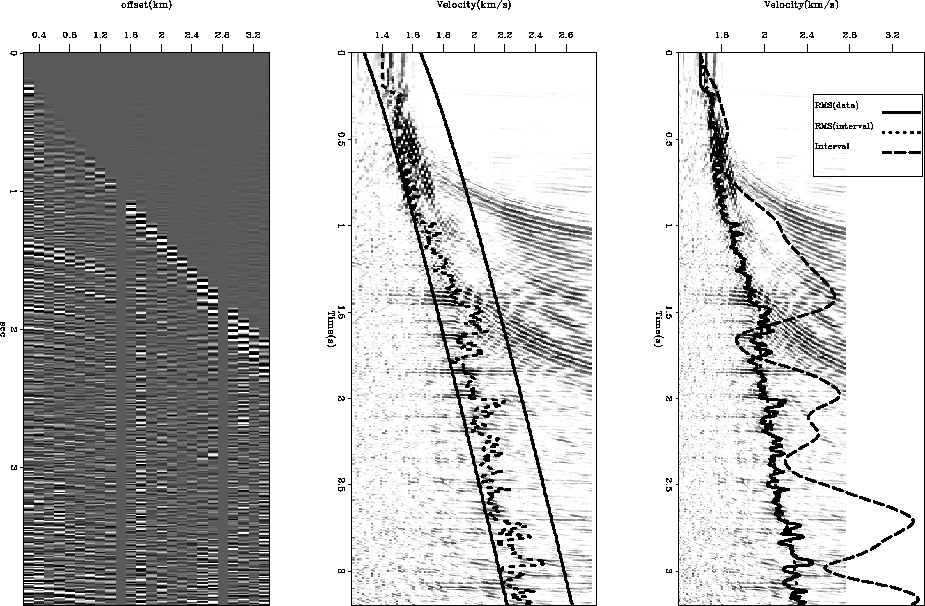
Figure ![[*]](http://sepwww.stanford.edu/latex2html/cross_ref_motif.gif) shows the result of applying this procedure
on a simple CMP gather. The left panel shows the initial CMP
gather and the center panel shows the stack power of
various values. We use the maximum within a reasonable
fairway (the solid lines overlaying the stack power scan) as our
data (dashed lines).
The right panel of Figure shows:
our auto-picked (solid line), our inverted (dashed lines), and our interval velocity converted back to
RMS velocity (dotted line).
shows the result of applying this procedure
on a simple CMP gather. The left panel shows the initial CMP
gather and the center panel shows the stack power of
various values. We use the maximum within a reasonable
fairway (the solid lines overlaying the stack power scan) as our
data (dashed lines).
The right panel of Figure shows:
our auto-picked (solid line), our inverted (dashed lines), and our interval velocity converted back to
RMS velocity (dotted line).
dix1
Figure 12
The left panel shows the initial CMP
gather. The center panel shows the stack power of
various values. Overlaid is a
fairway (the solid lines overlaying the stack power scan) that
we used for automatically picking RMS values
(dashed lines).
The right panel of Figure shows:
our auto-picked (solid line), our inverted for (dashed lines), and our interval velocity converted back to
RMS velocity (dotted line).
![[*]](http://sepwww.stanford.edu/latex2html/movie.gif)


Fitting goals (13) again assume a constant
variance in our data. This is an incorrect assumption
in this case for two very obvious regions.
First, the operator applied to our
data means that late times are going to be
given a much larger weight in our inversion.
A solution to this problem is introduce a weighting operator  ,which is simply
  .A second error in the assumption of
constant variance is that we know that not all our data ( measurements)
are of the same quality. The center panel of Figure
shows that there are areas where there are no significant
reflectors. In addition, there
are areas where our stack power results show
an obvious maximum at a given value and
other areas where the maximum is much less clear.
To try to take into account both of these phenomena
I calculated a weighted variance within the fairway
shown in the center panel of Figure ,
.A second error in the assumption of
constant variance is that we know that not all our data ( measurements)
are of the same quality. The center panel of Figure
shows that there are areas where there are no significant
reflectors. In addition, there
are areas where our stack power results show
an obvious maximum at a given value and
other areas where the maximum is much less clear.
To try to take into account both of these phenomena
I calculated a weighted variance within the fairway
shown in the center panel of Figure ,
|  |
(14) |
where
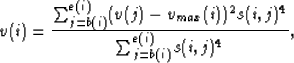
- b(i)
- is the beginning sample of the fairway at a given sample i,
- e(i)
- is the ending sample of the fairway at a given sample i,
- v(j)
- is the vrms at a given stack power location,
- vmax(i)
- is the velocity associated with the maximum stack power value (our data), and
- s(i,j)
- is the semblance value at time sample i and some vvrms value j.
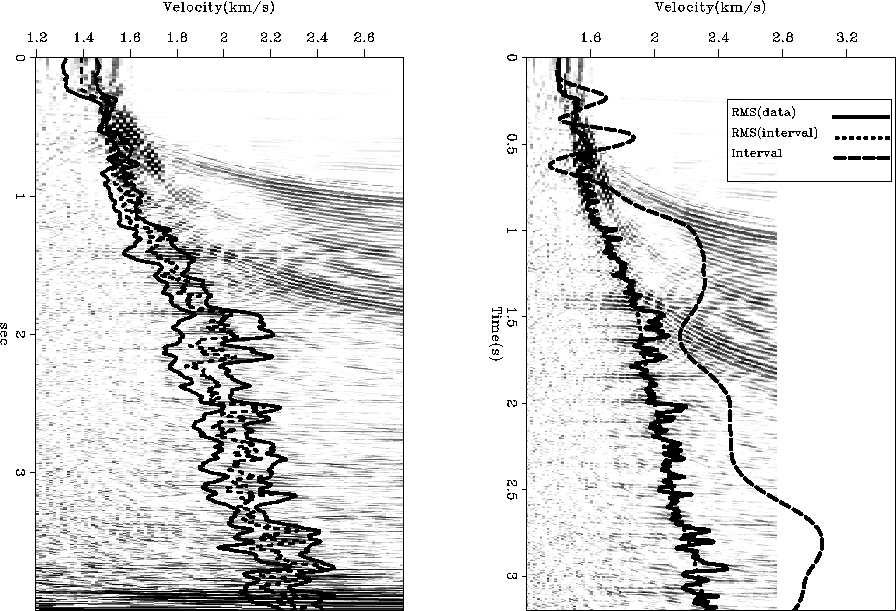
The left panel of Figure shows our stack power
scan overlaid by (dashed line) and  (dashed
lines). Note how at areas with a sharp stack power blob the
variance is small, while when the stack power blob is wide, where
we have little coherent energy, the variance is large.
We can now estimate new interval velocity model using,
(dashed
lines). Note how at areas with a sharp stack power blob the
variance is small, while when the stack power blob is wide, where
we have little coherent energy, the variance is large.
We can now estimate new interval velocity model using,
|  |
|
| (15) |
where  is
is  .
The right panel of Figure shows our data
, , and
.
The right panel of Figure shows our data
, , and  .
dix2
.
dix2
Figure 13 The left panel shows our stack power
scan overlaid by (dashed line) and (dashed
lines). The right panel of Figure shows our data
, , and .
Next: Multiple
Up: R. Clapp: Multiple realizations
Previous: and
Stanford Exploration Project
7/8/2003