


![[*]](http://sepwww.stanford.edu/latex2html/cross_ref_motif.gif) )
the Huber norm defined in Chapter and minimize
)
the Huber norm defined in Chapter and minimize
| |
(39) |
)], I selected a shows )] after 50 iterations, which
simulates a least-squares solution with damping. Note that
the scale bar is not displayed whenever
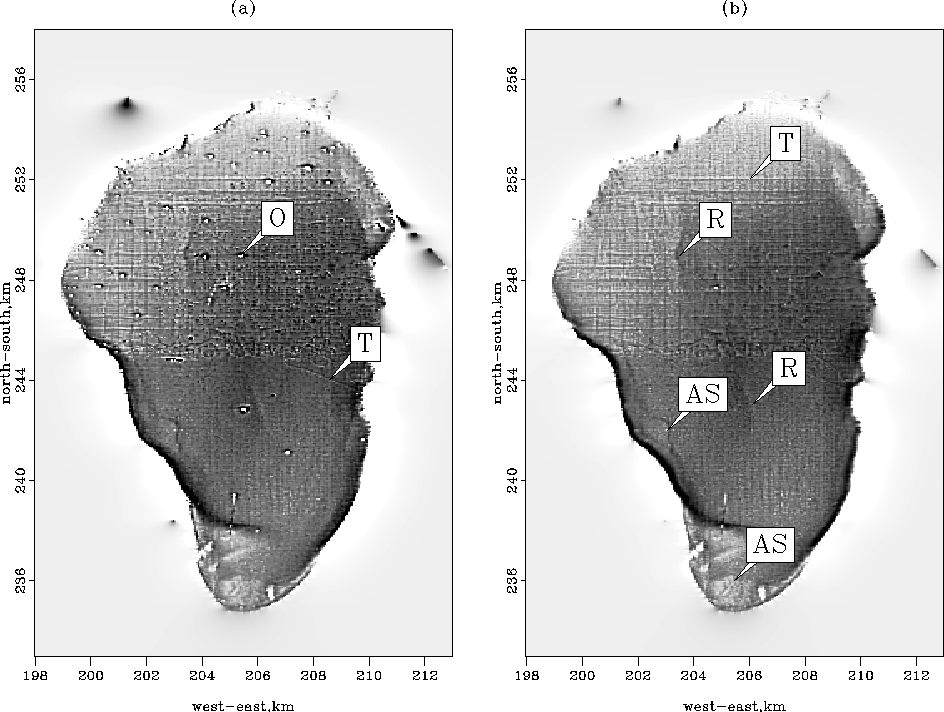
a. In addition, we can see the vessel
tracks in the north part of the map.
Figure b displays ![]() estimated with the
estimated with the
![]() norm [equation (]. Most of
the glitches are attenuated showing vessel tracks only.
Some ancient shorelines in the west part and south part of the Sea of
Galilee are now easy to identify (shown as ``AS'' in Figure
b). In addition, we also start to see
a ``valley'' in the middle of the lake (shown as ``R'' in Figure
b). This feature is also present in Figure
a where no attempts were made to remove the
spikes. Therefore, this can be either a geological feature that represents the
on-going rifting in this area or a track. The next section will prove
that this valley is not a processing artifact or some noise not
accounted for in our inversion scheme. The data outside the sea have been
also partially removed. The tracks (shown as ``T'' in Figure
) are still clearly visible after the attenuation
of the outliers because they do not fit the model of the noise we are
trying to remove.
norm [equation (]. Most of
the glitches are attenuated showing vessel tracks only.
Some ancient shorelines in the west part and south part of the Sea of
Galilee are now easy to identify (shown as ``AS'' in Figure
b). In addition, we also start to see
a ``valley'' in the middle of the lake (shown as ``R'' in Figure
b). This feature is also present in Figure
a where no attempts were made to remove the
spikes. Therefore, this can be either a geological feature that represents the
on-going rifting in this area or a track. The next section will prove
that this valley is not a processing artifact or some noise not
accounted for in our inversion scheme. The data outside the sea have been
also partially removed. The tracks (shown as ``T'' in Figure
) are still clearly visible after the attenuation
of the outliers because they do not fit the model of the noise we are
trying to remove.
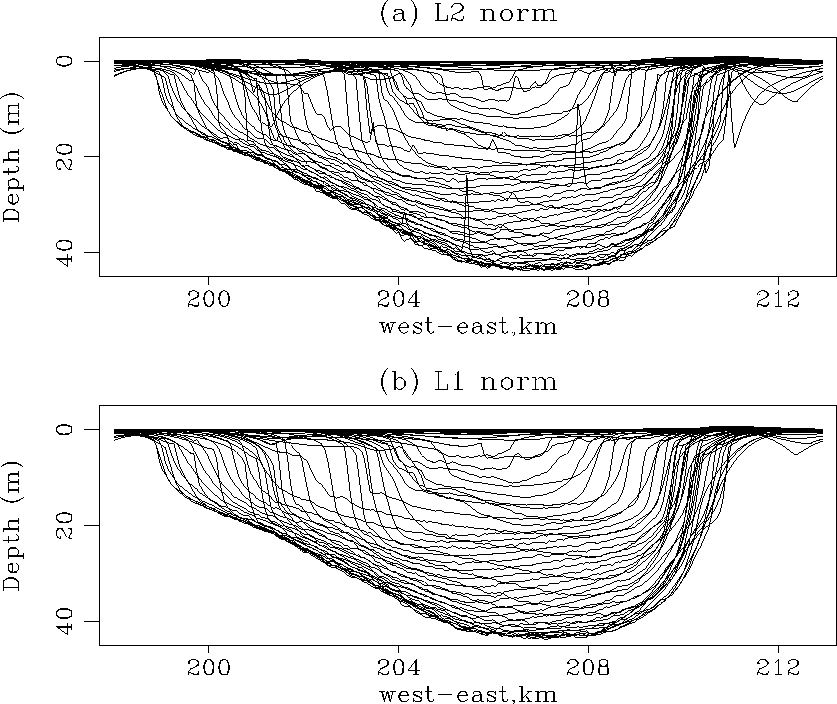
Figures a,b
show the bottom of the Sea of Galilee (![]() )after inversion. Each line represents one east-west line of the
interpolated data every 500 meters.
The
)after inversion. Each line represents one east-west line of the
interpolated data every 500 meters.
The ![]() result is a great improvement over the
result is a great improvement over the ![]() maps. The glitches inside and outside the sea
have disappeared. It is also pleasing to see that the
maps. The glitches inside and outside the sea
have disappeared. It is also pleasing to see that the ![]() norm
gives us positive depths everywhere. Although not everywhere
visible in Figure , it is interesting to notice
that we produce topography outside the lake.
Indeed, the effect of regularization is to produce synthetic
topography which is a natural continuation of the lake floor surface.
norm
gives us positive depths everywhere. Although not everywhere
visible in Figure , it is interesting to notice
that we produce topography outside the lake.
Indeed, the effect of regularization is to produce synthetic
topography which is a natural continuation of the lake floor surface.
I have shown that the combined utilization of preconditioning and
the Huber norm removes the spikes in the depth map of the Sea of Galilee.
In the next section, I propose removing the ship tracks by
introducing an operator in equation () that will model
the coherent noise created by different weather and human conditions during
the acquisition of the data.
 |
) in a least-squares sense after 50
iterations, which simulates a least-squares solution with
damping. (b) ) in a 


 |