


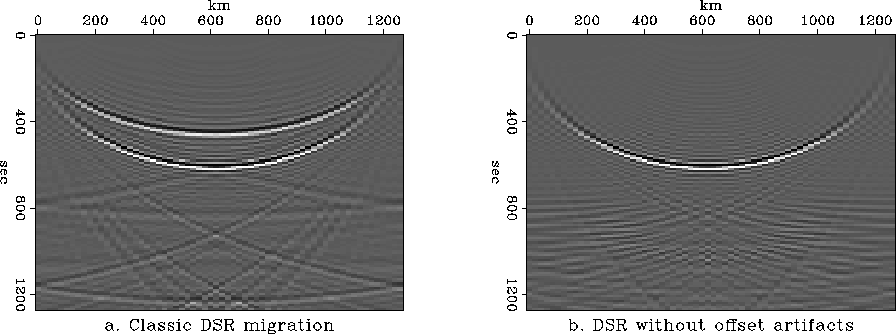
![[*]](http://sepwww.stanford.edu/latex2html/cross_ref_motif.gif) a shows the output of the DSR migration
applied to a data cube
(t,y,h) containing a single spike in a constant-offset section
with an half-offset h0=190m.
The shallower ellipse is an artifact. Compare this with
the output of the improved DSR migration in Figure b.
Because of the stacking in offset that is implicitly done in the
DSR equation, the artifacts are attenuated. However, when each
constant-offset section is taken separately,
the artifacts are a disturbing presence.
a shows the output of the DSR migration
applied to a data cube
(t,y,h) containing a single spike in a constant-offset section
with an half-offset h0=190m.
The shallower ellipse is an artifact. Compare this with
the output of the improved DSR migration in Figure b.
Because of the stacking in offset that is implicitly done in the
DSR equation, the artifacts are attenuated. However, when each
constant-offset section is taken separately,
the artifacts are a disturbing presence.
 |


The source of artifacts is equation (4), which
limits the interval of existence for the variable kh.
Normally the offset-wavenumber kh is evenly sampled between
the values ![]() in the DSR
offset-midpoint equation, necessary for the FFT
along the offset axis. However, the requirement for the square-root
expressions to be real limits the available values for kh.
Let's examine equation (4) again:
in the DSR
offset-midpoint equation, necessary for the FFT
along the offset axis. However, the requirement for the square-root
expressions to be real limits the available values for kh.
Let's examine equation (4) again:
![]()
![]()
| |
(9) |
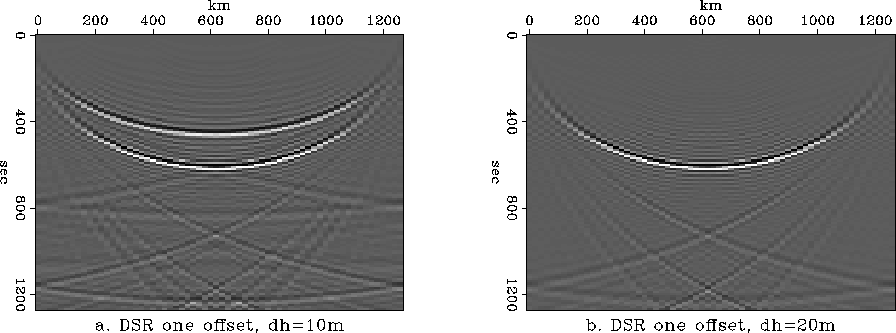
Equation (9) is used to migrate a
single impulse in a constant-offset
section with h=190m, using constant sampling in kh for all
the values ![]() .
In Figure the only difference
between the two migration programs is the offset spacing.
Bigger sampling in offset implies smaller sampling in offset-wavenumber.
As a result more offset-wavenumber samples are used to compute the phase
and reduce the artifacts. The ideal algorithm will use all the
available samples, dividing the integration limits in equation
(9) by the total number of offsets (assumed to be
equal to the number of offset-wavenumbers). This will not
preclude the use of FFT to transform the phase from offset-wavenumber
domain to offset domain, because for each pair of values
.
In Figure the only difference
between the two migration programs is the offset spacing.
Bigger sampling in offset implies smaller sampling in offset-wavenumber.
As a result more offset-wavenumber samples are used to compute the phase
and reduce the artifacts. The ideal algorithm will use all the
available samples, dividing the integration limits in equation
(9) by the total number of offsets (assumed to be
equal to the number of offset-wavenumbers). This will not
preclude the use of FFT to transform the phase from offset-wavenumber
domain to offset domain, because for each pair of values ![]() , the
variable kh is evenly sampled in the domain of definition.
, the
variable kh is evenly sampled in the domain of definition.
 |
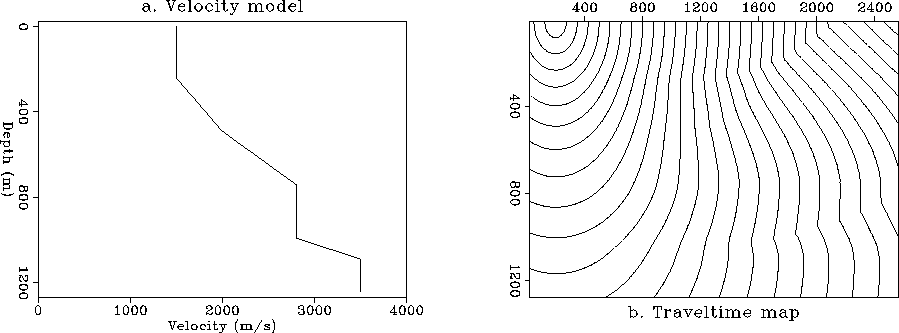
In order to use the different results of DSR migration algorithms
I create a prestack model consisting of 64 constant-offset sections
over three vertical diffractors in a depth variable velocity medium.
The velocity model is shown in Figure a while an example
of the zero-offset travel-time map is shown in Figure b.
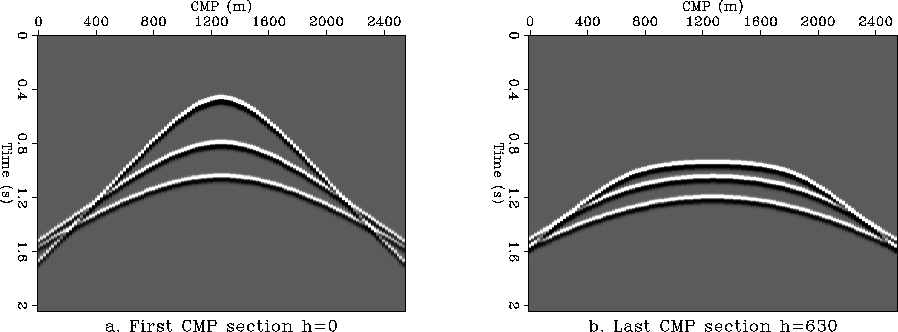
Figure a shows a zero-offset common midpoint (CMP) section,
while Figure b shows the CMP section corresponding
to the longest offset (h=630m).
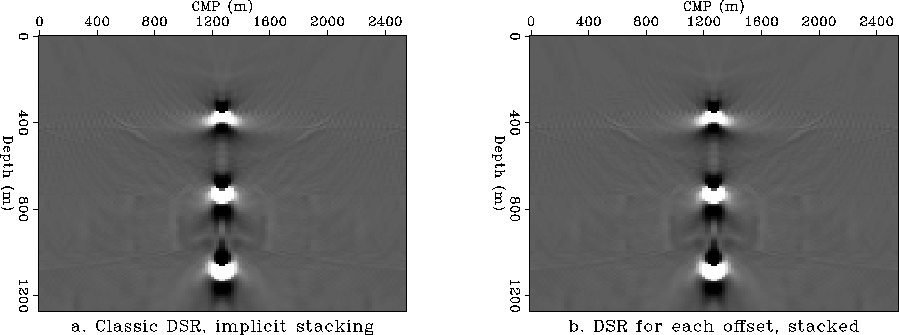
The prestack model was migrated using several variations of the
DSR migration algorithm. Figures a and b
compare the results of DSR migration via the classic algorithm
implementing equation (1) and the results of
DSR migration for separate offsets implementing equation
(8) using a FFT to transform
the phase. In both cases kh was constantly sampled.
To obtain Figure b all the
separate constant-offset sections were stacked in the end.
The two results are identical as is expected.
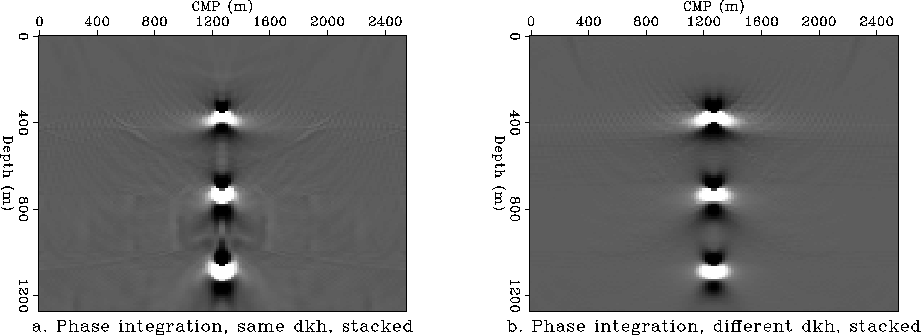
Figure a represents the results of
DSR migration by implementing equation (8)
directly. The integral in kh is calculated
numerically for each offset. The algorithm is slower
than the one evaluating the integral in kh via FFT,
but it does not require the migration of all the separate
constant-offset sections at the same time. Figure
b represents the results of DSR migration
with different sampling in kh for each ![]() pair.
Because stacking attenuates the artifacts the difference
between the two algorithms is not as visible in the
migrated CMP section.
pair.
Because stacking attenuates the artifacts the difference
between the two algorithms is not as visible in the
migrated CMP section.
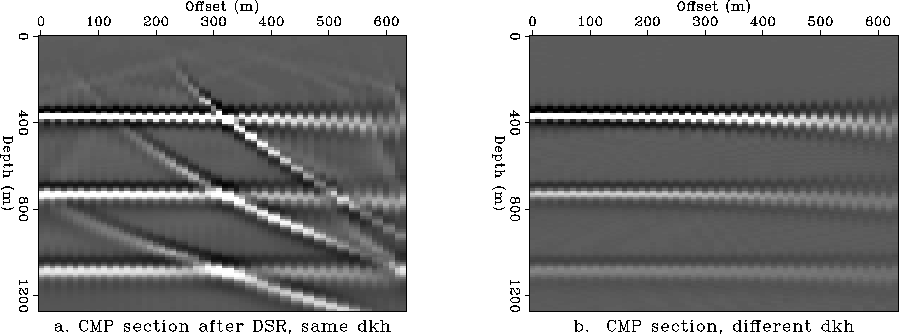
Figure
compares the migrated results of the same CMP, for
different offsets. The figure was obtained by slicing
vertically the migrated data set. The slice passes through the
location of the three diffraction events shown in
Figure . A correctly migrated image should
show the same events for all the offsets.
Figure a displays the diagonal artifacts
that appear using constant kh sampling. The diagonal
stripes create the ghost ellipse in Figure a.
Figure b is obtained using separate sampling of kh
for each ![]() pair, and all
artifacts are virtually eliminated.
pair, and all
artifacts are virtually eliminated.
 |
 |
 |
 |
 |