


Using the relationships between dry, solid, and saturated elastic moduli
that were defined in the previous sections,
we calculate the P- and S-wave velocities
of Model 1 and Model 2 for different hydrate saturations.
We assume a basic and simple rock model consisting of pure, high-porosity (![]() ) sandstone subjected to a confining pressure of 10 MPa. Since the hydrates usually form
at a subbottom depth of only several hundred meters, these conditions resemble
the in-situ conditions. To simulate hydrate formation,
we calculated the effective dry moduli of the hydrate layer with the
help of either both equations (1) and (2) or equations
(5) through (8). The saturated velocities are again
obtained from equations (9) through (18).
The sediment underlaying the hydrated sediment
is saturated by either 100% water or a water-gas mixture, depending on the
origin of the methane.
Assuming that this sediment is unconsolidated, its dry moduli are calculated using the Herz-Mindlin
contact theory as described by equations (5) through
(8). Subsequently,
equations (9) through (18) are used to determine the
effective bulk moduli after brine or gas saturation and to estimate the
corresponding P-wave and S-wave velocities.
The properties of the quartz, pure hydrate, water, and gas used for these
simulations are listed in Table 1.
) sandstone subjected to a confining pressure of 10 MPa. Since the hydrates usually form
at a subbottom depth of only several hundred meters, these conditions resemble
the in-situ conditions. To simulate hydrate formation,
we calculated the effective dry moduli of the hydrate layer with the
help of either both equations (1) and (2) or equations
(5) through (8). The saturated velocities are again
obtained from equations (9) through (18).
The sediment underlaying the hydrated sediment
is saturated by either 100% water or a water-gas mixture, depending on the
origin of the methane.
Assuming that this sediment is unconsolidated, its dry moduli are calculated using the Herz-Mindlin
contact theory as described by equations (5) through
(8). Subsequently,
equations (9) through (18) are used to determine the
effective bulk moduli after brine or gas saturation and to estimate the
corresponding P-wave and S-wave velocities.
The properties of the quartz, pure hydrate, water, and gas used for these
simulations are listed in Table 1.
| substance | K [MPa] | vp [m/s] | vs m/s] | ||
| quartz | 36600 | 45000 | 2650 | 6037 | 4121 |
| water | 2250 | 1000 | 1500 | ||
| pure hydrate | 5600 | 2400 | 767 | 3450 | 1769 |
| gas | 10 | 100 | 375 |
Table 1: Properties of water, gas, pure hydrate and quartz
Figure 3 shows the velocity behavior of the hydrate-bearing
sandstones for different hydrate saturations.
These are compared with the velocities Vp and Vs of sandstone with
different gas saturation in order to create a visualization of
the change in properties
at the transition to hydrate-bearing sediment.
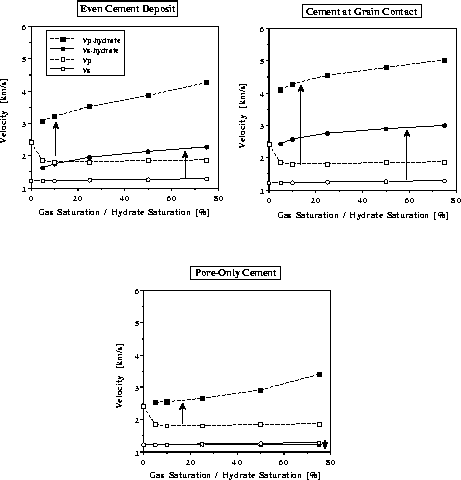 |

It is obvious that the velocity behavior in the case where the hydrate was deposited at the grain contacts and in the case where it was deposited uniformly on the grain surface is very similar. In both cases, merely small amounts of hydrate saturation increase the P- and S-wave velocities considerably compared to brine and gas-saturated sandstone. The more hydrate is deposited, the stiffer the rock becomes, and the faster are its P- and S-wave velocities. This effect is even more evident for hydrate deposition at the grain contacts than it is for the uniform hydrate deposition on the grain surface.
The solidification of the hydrate in the pore-space only, on the other hand, affects the velocities in a slightly different way. Small amounts of hydrate deposition cause a negligibly, small increase of the P-wave velocity with regard to brine-saturated sandstone, and do not cause any change at all in the S-wave velocity. To obtain a noticeable increase in the P-wave velocity, a significant (> 15% by volume) amount of hydrate has to deposited. Even then, there is barely a change in the S-wave velocity. Since deposition in the pore space does not immediately affect the stiffness of the rock, this velocity behavior can be expected. Comparison of the velocities with those of gas-saturated sandstone shows an increase in the P-wave velocity and a slight decrease in the S-wave velocity.
The increase in P-wave velocity in all three models agrees well with seismic velocity analyses of in-situ BSRs Ecker and Lumley (1994); Hyndman and Spence (1992); Katzman et al. (1994); Singh et al. (1993). While a sufficient increase can be obtained with only a small amount of hydrate in the cementation models, the pore-only deposition model requires a considerable amount of hydrate to be present in order to obtain the same P-wave velocity increase. Since the P-wave velocities alone cannot discriminate between the unique models, the S-wave velocities in the hydrate structures are of importance. Since the S-wave velocity behavior is different depending on hydrate cementation or merely on deposition in the pore space, seismic AVO analysis should be a good indicator of the deposition structure found in-situ.