Next: CONCLUSIONS
Up: THEORY
Previous: Preconditioning
In depth tomography we must constantly deal with the depth-velocity
ambiguity problem. Put another way, we are simultaneously
trying to estimate both a focusing (Sf) and a mapping (Sm)
slowness. Biondi et al.1997 showed
that by mapping (z,x) into ( ) through
|  |
(8) |
we can write a focusing eikonal equation which only
indirectly depends on the mapping velocity
|  |
(9) |
where  is the differential mapping operator defined as
|  |
(10) |
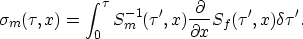
From this eikonal equation we can derive a new relation for the
change in travel time due to a change in the focusing velocity:
|  |
(11) |
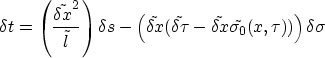
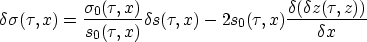
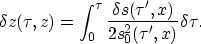
where
 and
and  are the change in
x and
are the change in
x and  position of the ray segment,
 is the differential
mapping factor of our initial
slowness model at the ray location, and
is the differential
mapping factor of our initial
slowness model at the ray location, and
 is defined as
|  |
(12) |
where
|  |
(13) |
We now have a way to back project travel time errors and can
write a new set of fitting goals,
| 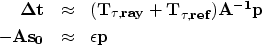 |
|
| (14) |
where  and
and  use (11) rather
than (2) to back project.
use (11) rather
than (2) to back project.
SYNTHETIC TESTS
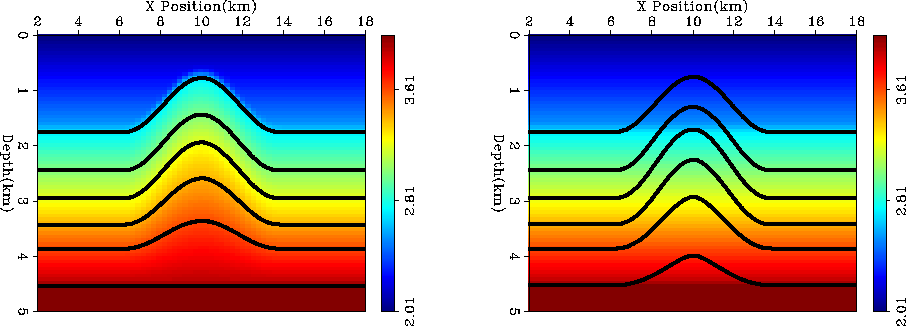
To test the effectiveness of the method we create a simple anticline
synthetic velocity model, Figure 2. We simulated six
reflectors, one on top, four in the anticline, and a basement reflector.
We calculated travel times to all the reflectors for an offset range of
4 kms. These travel times represent our `recorded travel times'. For our
initial model we created a v(z) model by taking the lateral average
of the velocity field, Figure 2.
model
Figure 2 Left panel is our synthetic model superimposed
by the six reflectors. The right panel is our starting guess for our
velocity function and the map migrated reflector position using this initial
velocity estimate.


From this initial model we attempted to invert the velocity function
by three progressively advanced methods:
- Depth-Standard
- : Inverted for a depth model, using an
inverse Laplacian preconditioner Claerbout (1998b) for
 in our depth fitting goals
(7)
in our depth fitting goals
(7)
- Depth-Steering
- : Inverting for a depth model, using a
steering filter operator for our preconditioner in our depth fitting
goals (7)
- Tau-Steering
- : Inverting for a tau model, using a
steering filter operator for our preconditioner in
tau fitting goals (14)
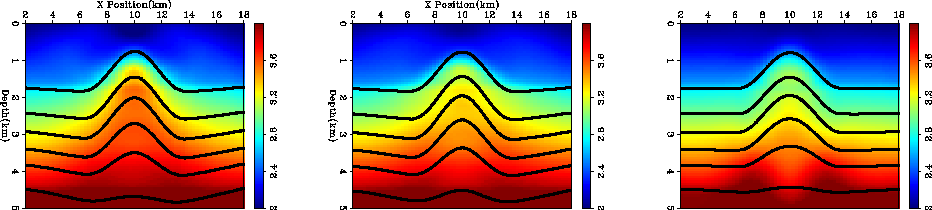
Figure 3 shows the result of one non-linear iteration
for all three inversions schemes. All three methods were able to recover
the dome shape after one iteration. When using a Laplacian smoother
the velocity increase is spread too far both laterally and vertically.
As a result, the bottom reflector is located too deep throughout
the model. When using steering filters we still have a significant
velocity-depth ambiguity problem, but we have done a little
better job position the bottom reflector. In the case of tau tomography
with steering filters we have done almost a perfect job after a single
iteration. We have not perfectly recovered the lower portion of the
anticline structure but we have almost completely flattened the bottom
reflector.
model1-iter1
Figure 3 Left panel is Depth-Standard, middle
is Depth-Steering, right is Tau-Steering. All after 1 non-linear iteration.
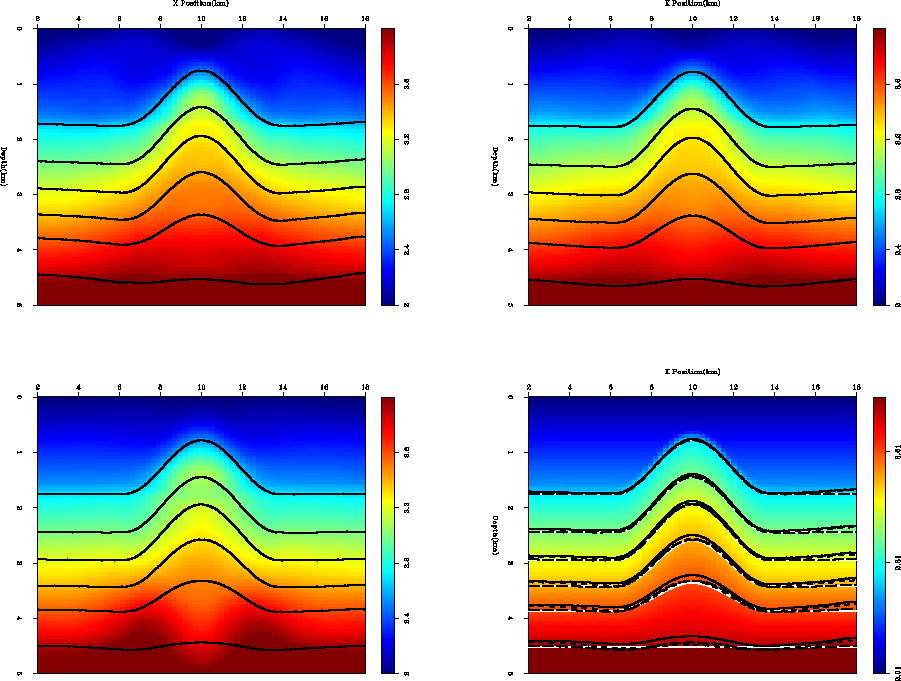
To see if, and how fast, we could converge to the correct solution
in depth
we performed several more non-linear iterations. As
Figure 4
shows we did a decent job recovering the anticline with all three methods.
In this case, where the model is fairly simple and we have good travel time
coverage, the big advantage seems to be speed. We got a high quality result
with steering filter tau tomography in a single iteration, while it
took three with steering filter depth tomography, and four when using
the Laplacian and depth tomography.
model1-best
Figure 4 Top-left: Depth-Standard, after
4 non-linear iterations; top-right: Depth-Steering after 3 iterations;
bottom-left: Tau-steering after 1 iteration; and bottom-right:
a comparison of the reflector positions using all 3 methods. The solid,
white line is correct reflector position, the small dashes represent
Tau-Steering: large-dashes:Depth-Steering; and the solid black line
is Depth-Standard.
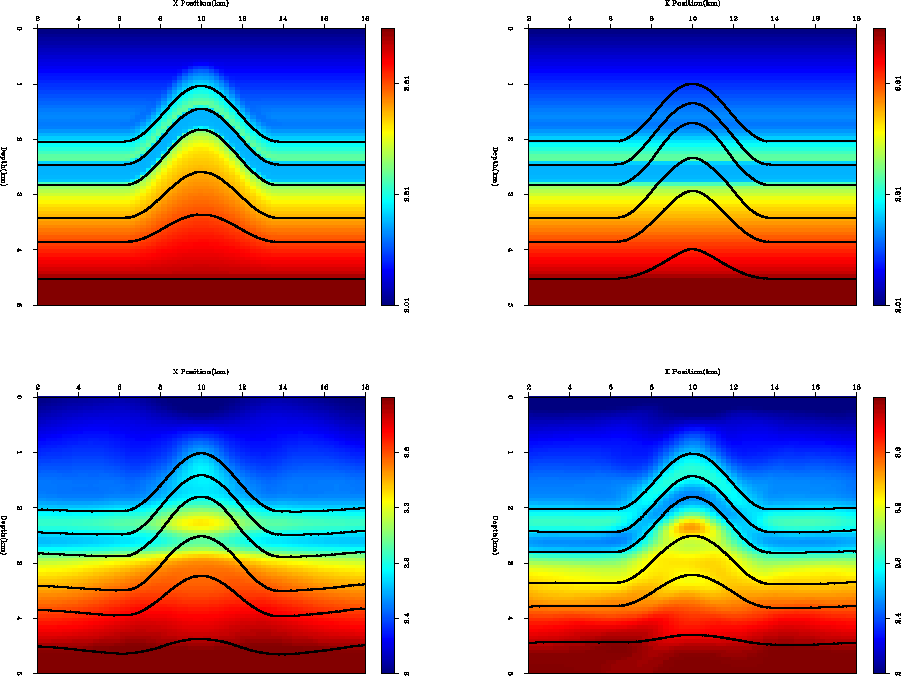
The smoothness of the anticline was well suited for the Laplacian
so we decided on
a slightly more difficult challenge that could better
differentiate between a Laplacian and steering filter regularization.
Our new model
keeps the same basic shape for the model but adds a low velocity
layer within the anticline.
Figure 5 shows the correct, initial, and the result
of 4 iterations using both the Laplacian and steering filters to
precondition the problem. After 4 iterations the steering
filters have done a much better job recovering the low velocity layer.
model2
Figure 5 Top, left Our new model with
a low velocity layer within the anticline; top-right, our starting model;
bottom-left, Depth-Standard after 4 iterations; bottom-right Depth-Steering
after 4 iterations.
TEST ON REAL DATA
We next decided to test the method on real data.
For this initial test we decided to work with a relatively
clean data which still had some residual move-out in the
common reflection point (CRP) gathers.
The data is from the Blake Outer Ridge as was used by
Ecker1998 to characterize methane hydrate structures.
For our initial velocity model we used Ecker's Dix 1955
derived model, Figure 6.
Our general philosophy was to limit human time as much as possible.
Therefore we chose to do tau migration
Alkhalifah (1998) using a generic Kirchhoff
packageBiondi (1998).
By using tau rather than depth migration,
we were quickly able to compare CRPs from iteration
to iteration and it allowed us to pick reflector positions
only once.
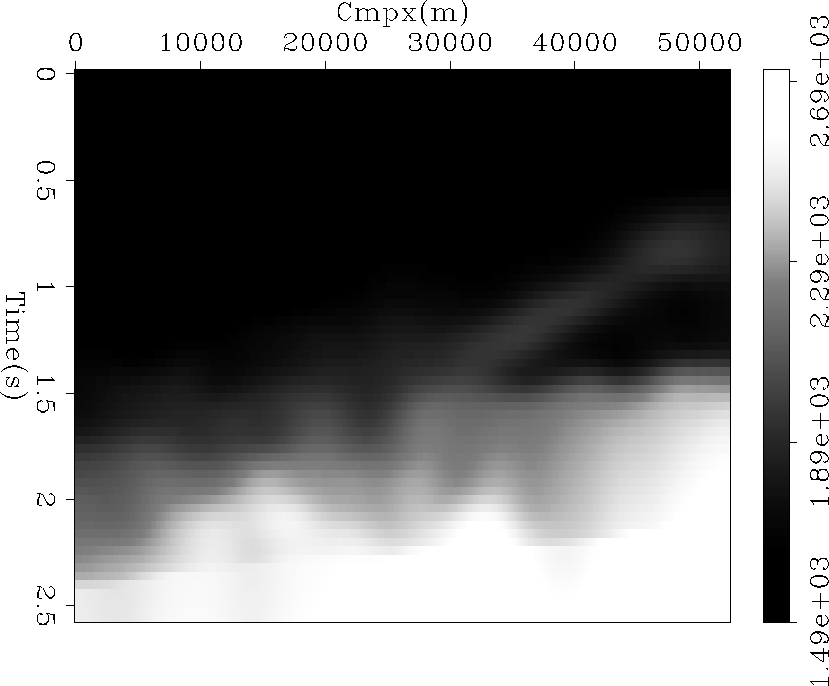
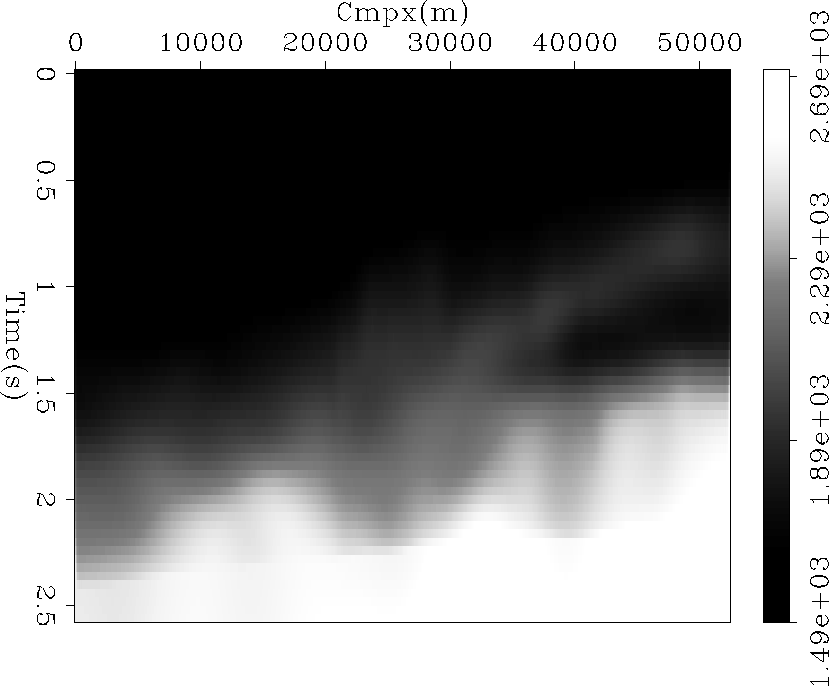
christine-vel0
Figure 6 Initial velocity model in depth. Note
the low velocity zone caused by the gas hydrate starting at approximately
32000 kms and extending to the end of the section.
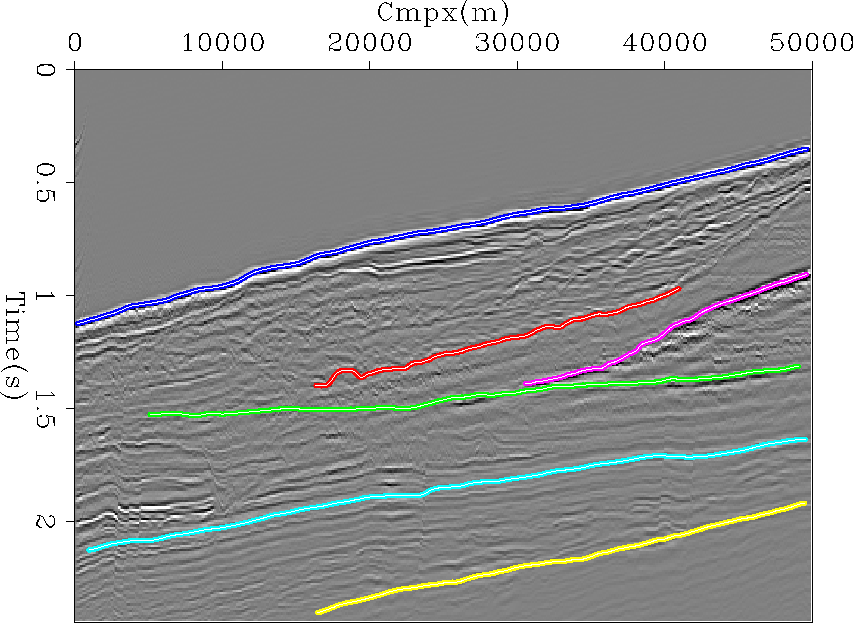
After performing the migration we picked six reflectors,
Figure 7. We picked the sea floor, a strong reflector
above the bottom simulating reflector (BSR), the BSR itself, the flat
reflector
below the BSR, and two deeper reflectors.
stack
Figure 7 Initial stack overlaid by reflectors picked for
tomography.
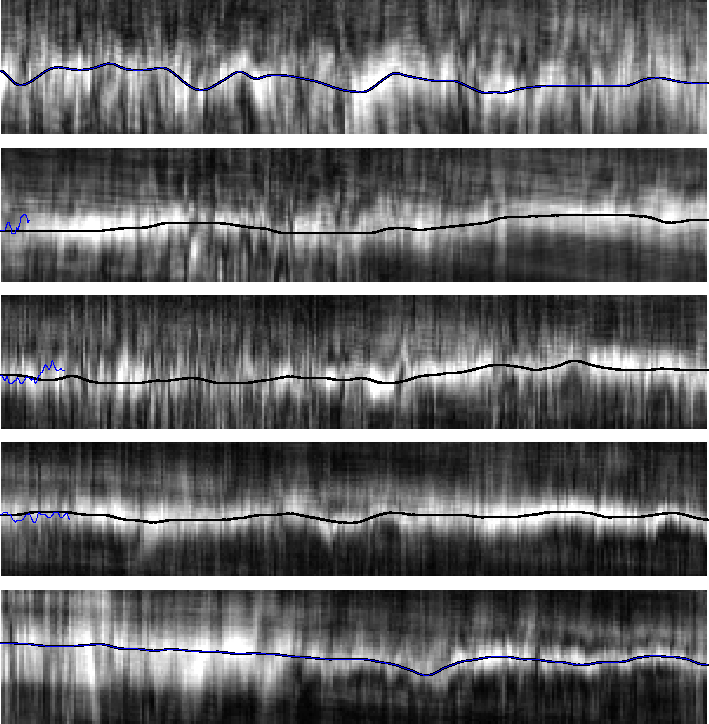
Rather than pick move-out differences we decided to create
residual semblance panels at each reflector location, Figure 8.
The panels indicate that there is significant residual curvature, especially
where the BSR meets the lower reflector. From these semblance
panels we picked smooth curves
at approximately the maximum semblance at each reflector.
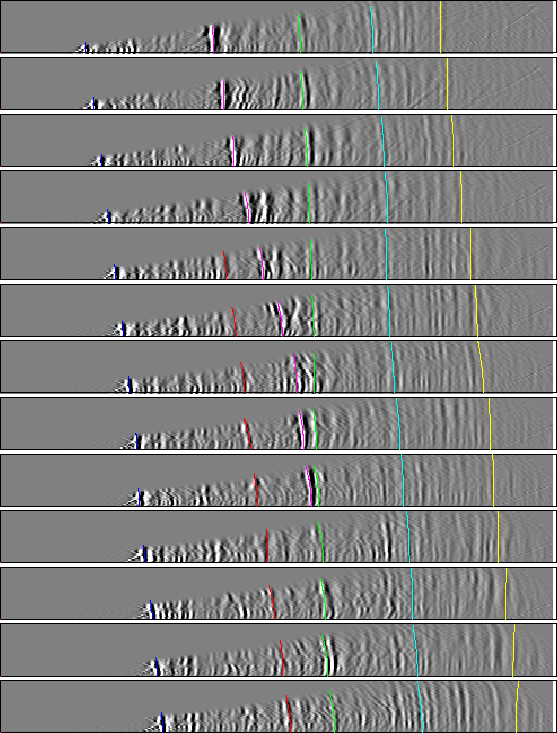
To check to see if a single parameter adequately described the move-outs we
back projected the picked semblance into our CRP gathers.
Figure 9 shows that the semblance
picks did a fairly good job describing the move-out.
sem-vel0
Figure 8 Residual semblance panels for the bottom
5 reflectors. The black line in each panel represents the picked maximum.
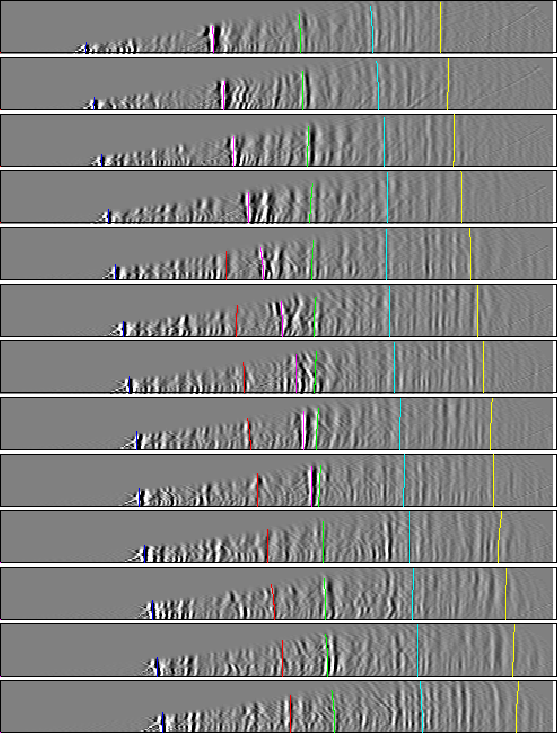
overlay.vel0
Figure 9 Common reflection point gathers from every
2000 meters starting from 28000.
The lines are the result of mapping back
the picked residual slowness values. Note how the curves do an excellent
job matching the actual reflector move-out.
We used our picked reflectors to construct our steering filters
and then
applied our tau tomography fitting
goals (14). Generally, we have increased velocity,
Figure 10, but the changes still keep velocity following
reflector dip.
christine-vel1
Figure 10 The velocity after 1 iteration of
tau-steering tomography
The next step is to see if our new velocity model flattens
our CRP gathers and improves the focusing of the data. Figures
11 and 12 indicate that we
have accomplished both of these goals. Figure 9 shows
that all of our reflectors are significantly flatter, with only
significant curvature left along the BSR. Figure 12
shows a much more continuous BSR reflection along with overall improved
focusing of the section above and below.
overlay.vel1
Figure 11 CRP gather from 24000-48000 meters.
Note how they are considerably flatter than Figure 9.
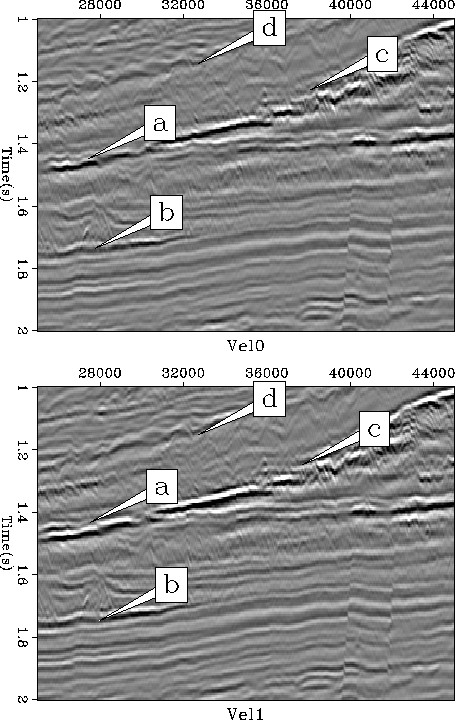
stack-comp
Figure 12 The stack using our initial velocity and
the velocity after 1 iteration of tau steering tomography. Note how
the reflectors are generally better focused at a, b, c, and d.
Next: CONCLUSIONS
Up: THEORY
Previous: Preconditioning
Stanford Exploration Project
4/20/1999